

If you’ve ever wished you could see exactly how customers find, compare, and buy products on Amazon, Brand Analytics is the tool for you. It’s a powerful set of reports that shows you what’s happening behind the scenes, using real Amazon shopping data. This means you can stop making business decisions based on guesswork.
What Is Amazon Brand Analytics?
Many sellers think of Brand Analytics as just another complicated feature hidden in Seller Central. It’s actually a straightforward tool that provides direct insight into customer search behavior. You can see which keywords are trending, what other products shoppers buy with yours, and which competitors they consider before purchasing.
To access this data, you must be enrolled in the Amazon Brand Registry program. This requires having a registered trademark for your brand. If you don’t have one yet, Amazon’s IP Accelerator program can help you get started.
Being part of Brand Registry offers more than just analytics; it provides brand protection tools and advanced marketing features. You can explore the full range of Amazon Brand Registry benefits in our detailed guide.
Once enrolled, you can access these reports in Seller Central and Vendor Central for free. It’s a standard feature for every brand owner on the platform.
A Quick Look at the Key Reports
With around 2.3 million active sellers on Amazon, Brand Analytics provides a significant advantage. The reports turn raw data from over 310 million active users into actionable insights for your business.
Here’s a summary of the most useful reports and what they offer.
| Report Name | What It Shows You | How to Use It |
|---|---|---|
| Customer Journey Analytics | Shows how shoppers move through each funnel stage; awareness, consideration, and purchase, across your selected ASINs. | Identify where customers drop off and which products or campaigns drive the most conversions within the buying path |
| Customer Loyalty Analytics | Shows how often shoppers return to buy from your brand and which products drive repeat purchases. | Track customer retention and discover which ASINs create the strongest brand loyalty. |
| Search Catalog Performance | The complete customer journey for your products, from first impression to final purchase. | Find drop-off points in your sales funnel where customers are losing interest. |
| Search Query Performance | Shows how shoppers discover your brand through search terms and how those terms convert into clicks and sales. | Find high-performing keywords and improve visibility across relevant search results. |
| Top Search Terms | Shows the most popular search terms on Amazon that customers use to find products in your category. | Use it to identify high-demand keywords and optimize listings for better reach and sales. |
| Market Basket Analysis | What other products your customers buy at the same time as yours. | Create product bundles and develop cross-selling strategies. |
| Repeat Purchase Behavior | How many orders are from new versus repeat customers for a product or your entire brand. | Measure customer loyalty and calculate customer lifetime value. |
| Demographics | Aggregated data on your customers, including age, household income, and education level. | Refine your target audience and customize your marketing messages. |
These reports are your strategic guide. They give you the information you need to improve your product listings, refine your SEO, and build effective PPC campaigns.
How to Read the Most Important Reports
Getting started with Amazon Brand Analytics can feel overwhelming, with many different metrics to track. But once you understand which reports matter most, you can get clear answers about your customers and competitors.
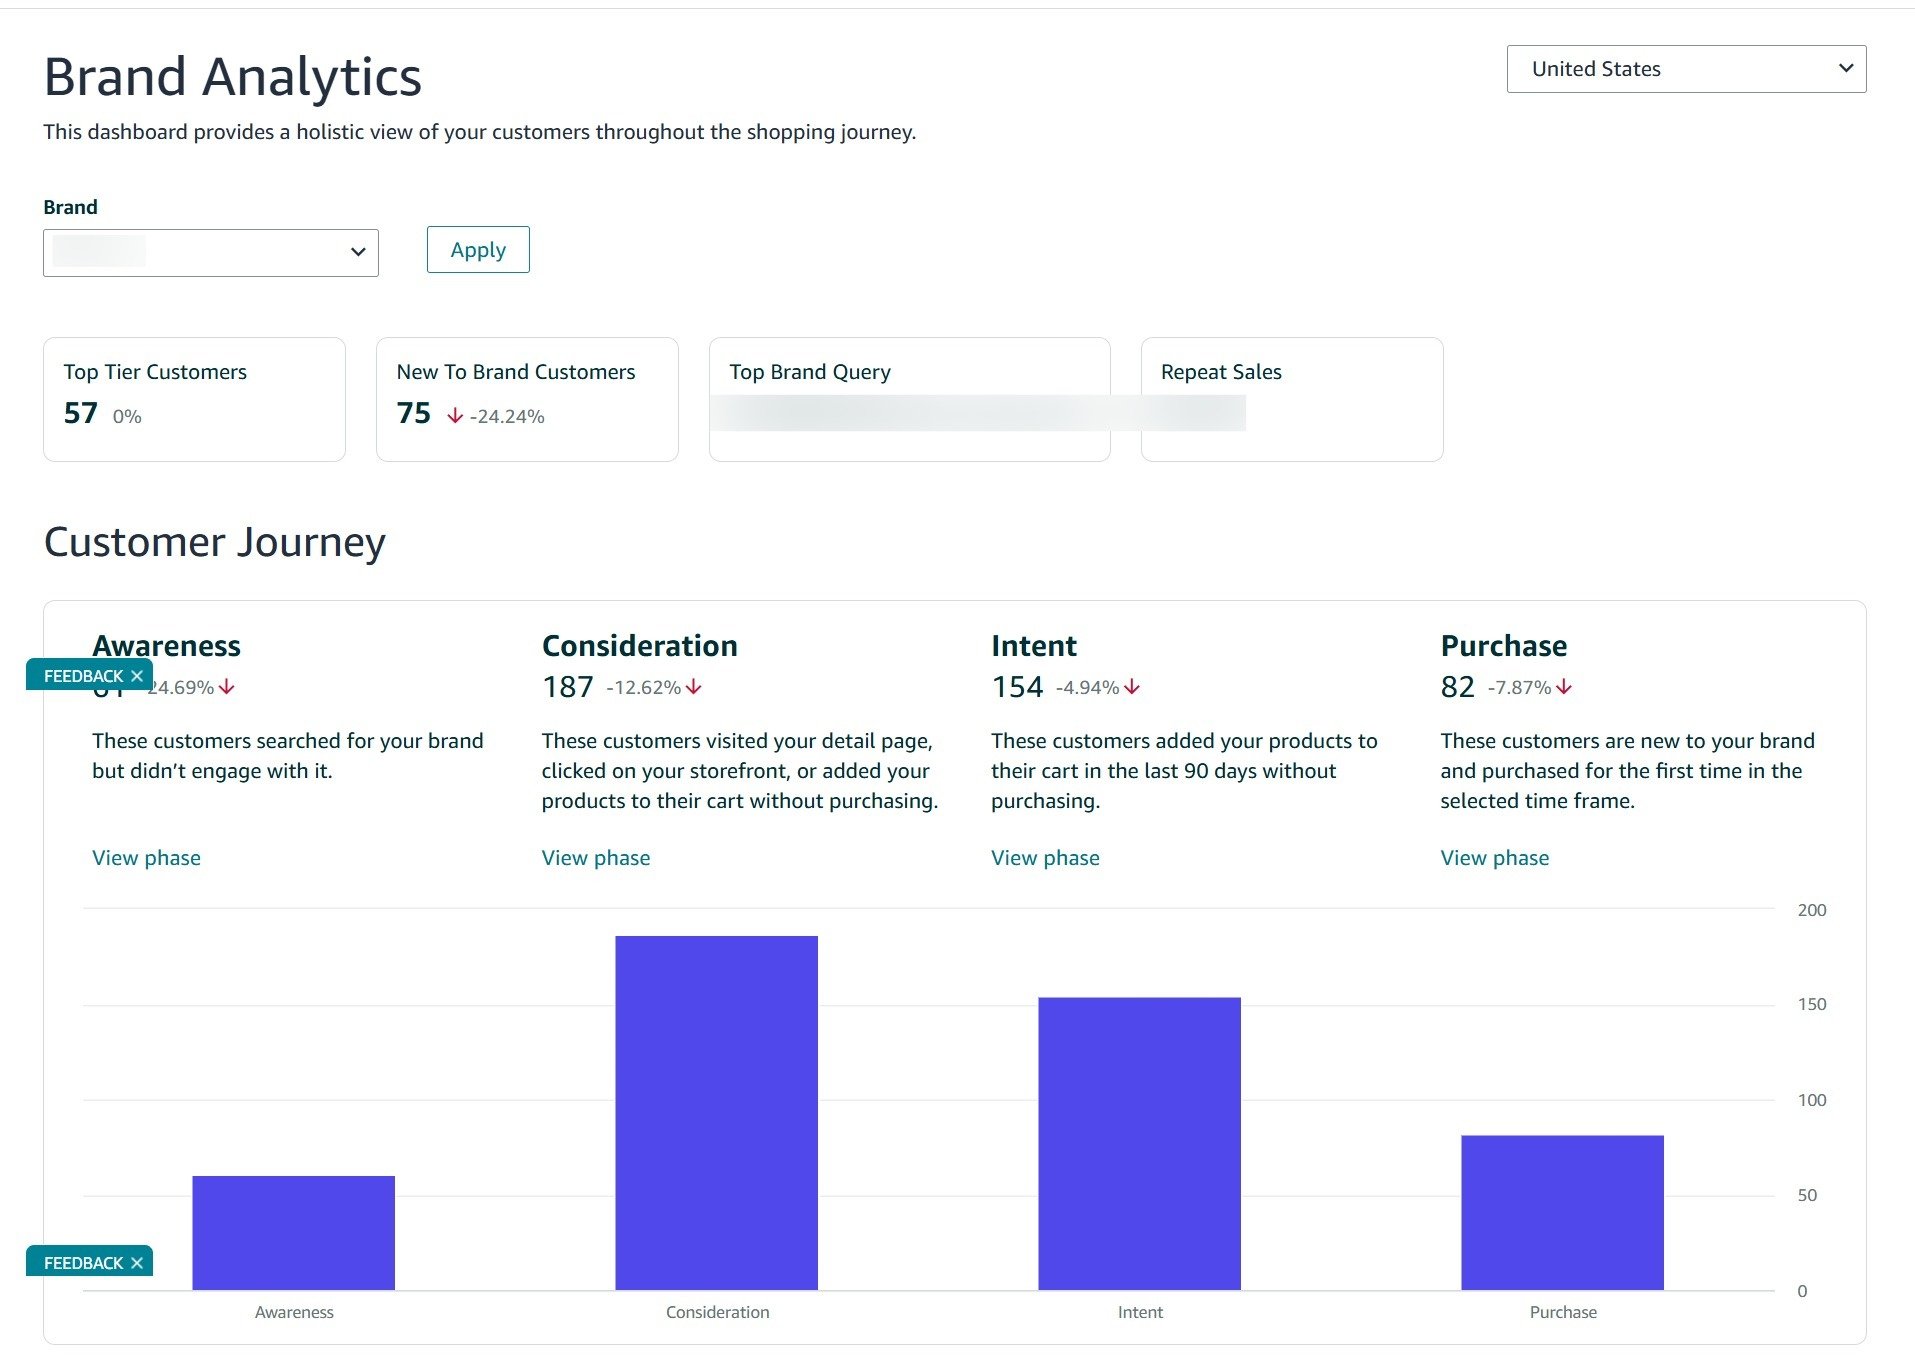
We’ll focus on the four reports that provide the most immediate value. The main Brand Analytics dashboard in Seller Central is your starting point.

From here, you can set your reporting range (weekly, monthly, or quarterly) and access specific dashboards to understand what your customers are doing.
1. Customer Journey Analytics
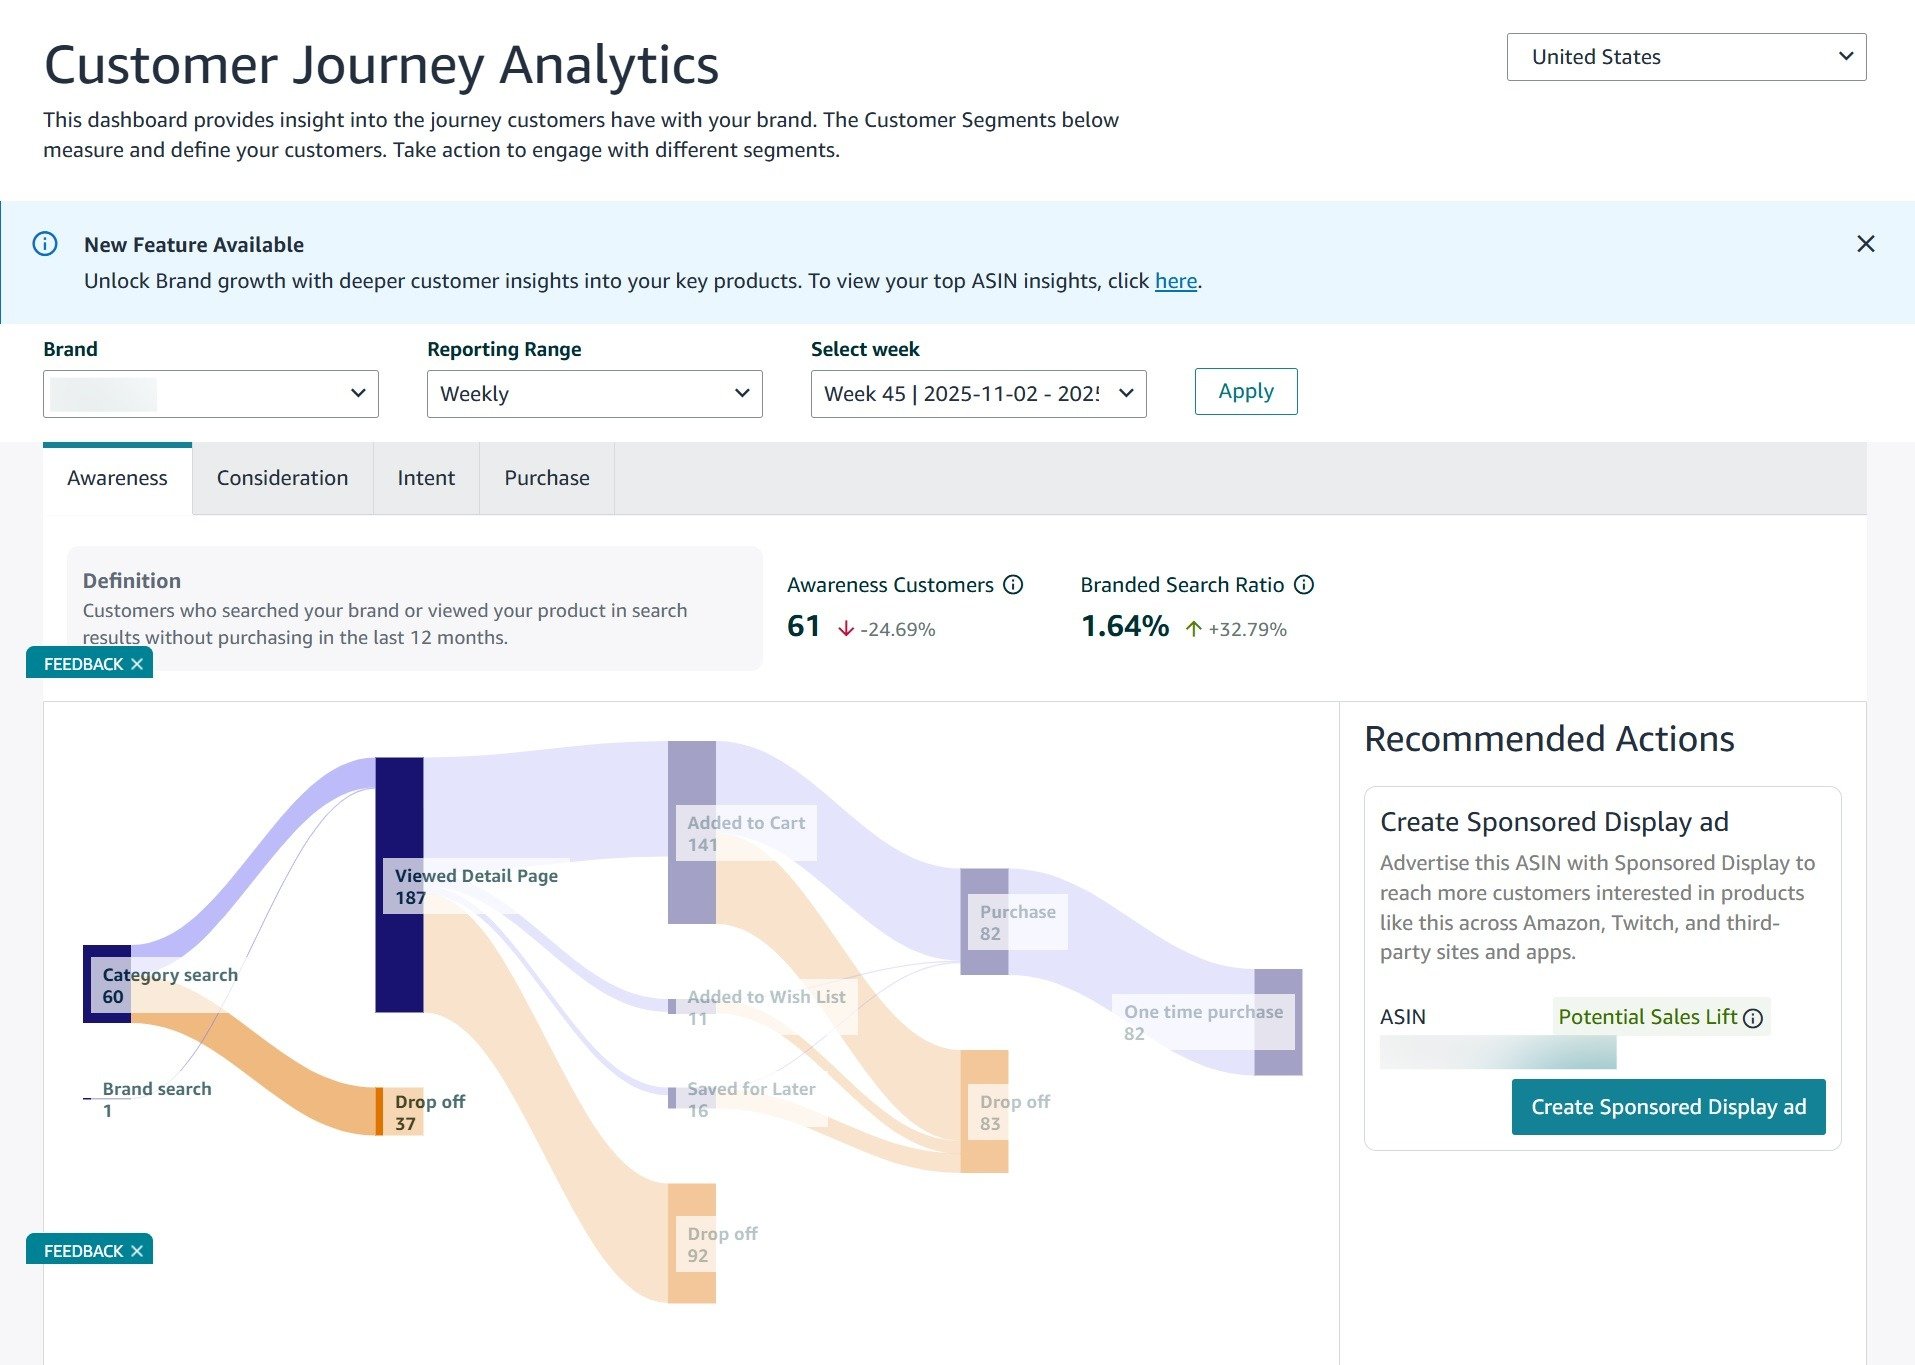
Ever wondered how shoppers move from discovering your brand to making a purchase? The Customer Journey Analytics report shows the full path customers take, including awareness, consideration, and final purchase stages.
This information can help you:
- Create Targeted Marketing Strategies: Understand which stages of the buying journey need more attention and adjust campaigns to guide customers toward purchase.
- Optimize Product Pages and Content: If shoppers drop off at the consideration stage, improve your product detail pages, A+ Content, or Amazon Storefront to keep them engaged.
- Refine PPC Campaigns: Use the insights to focus ad spend on keywords and placements that drive conversions at each step of the funnel.
This report helps you visualize the complete shopping journey and make data-driven decisions to increase conversions and sales.
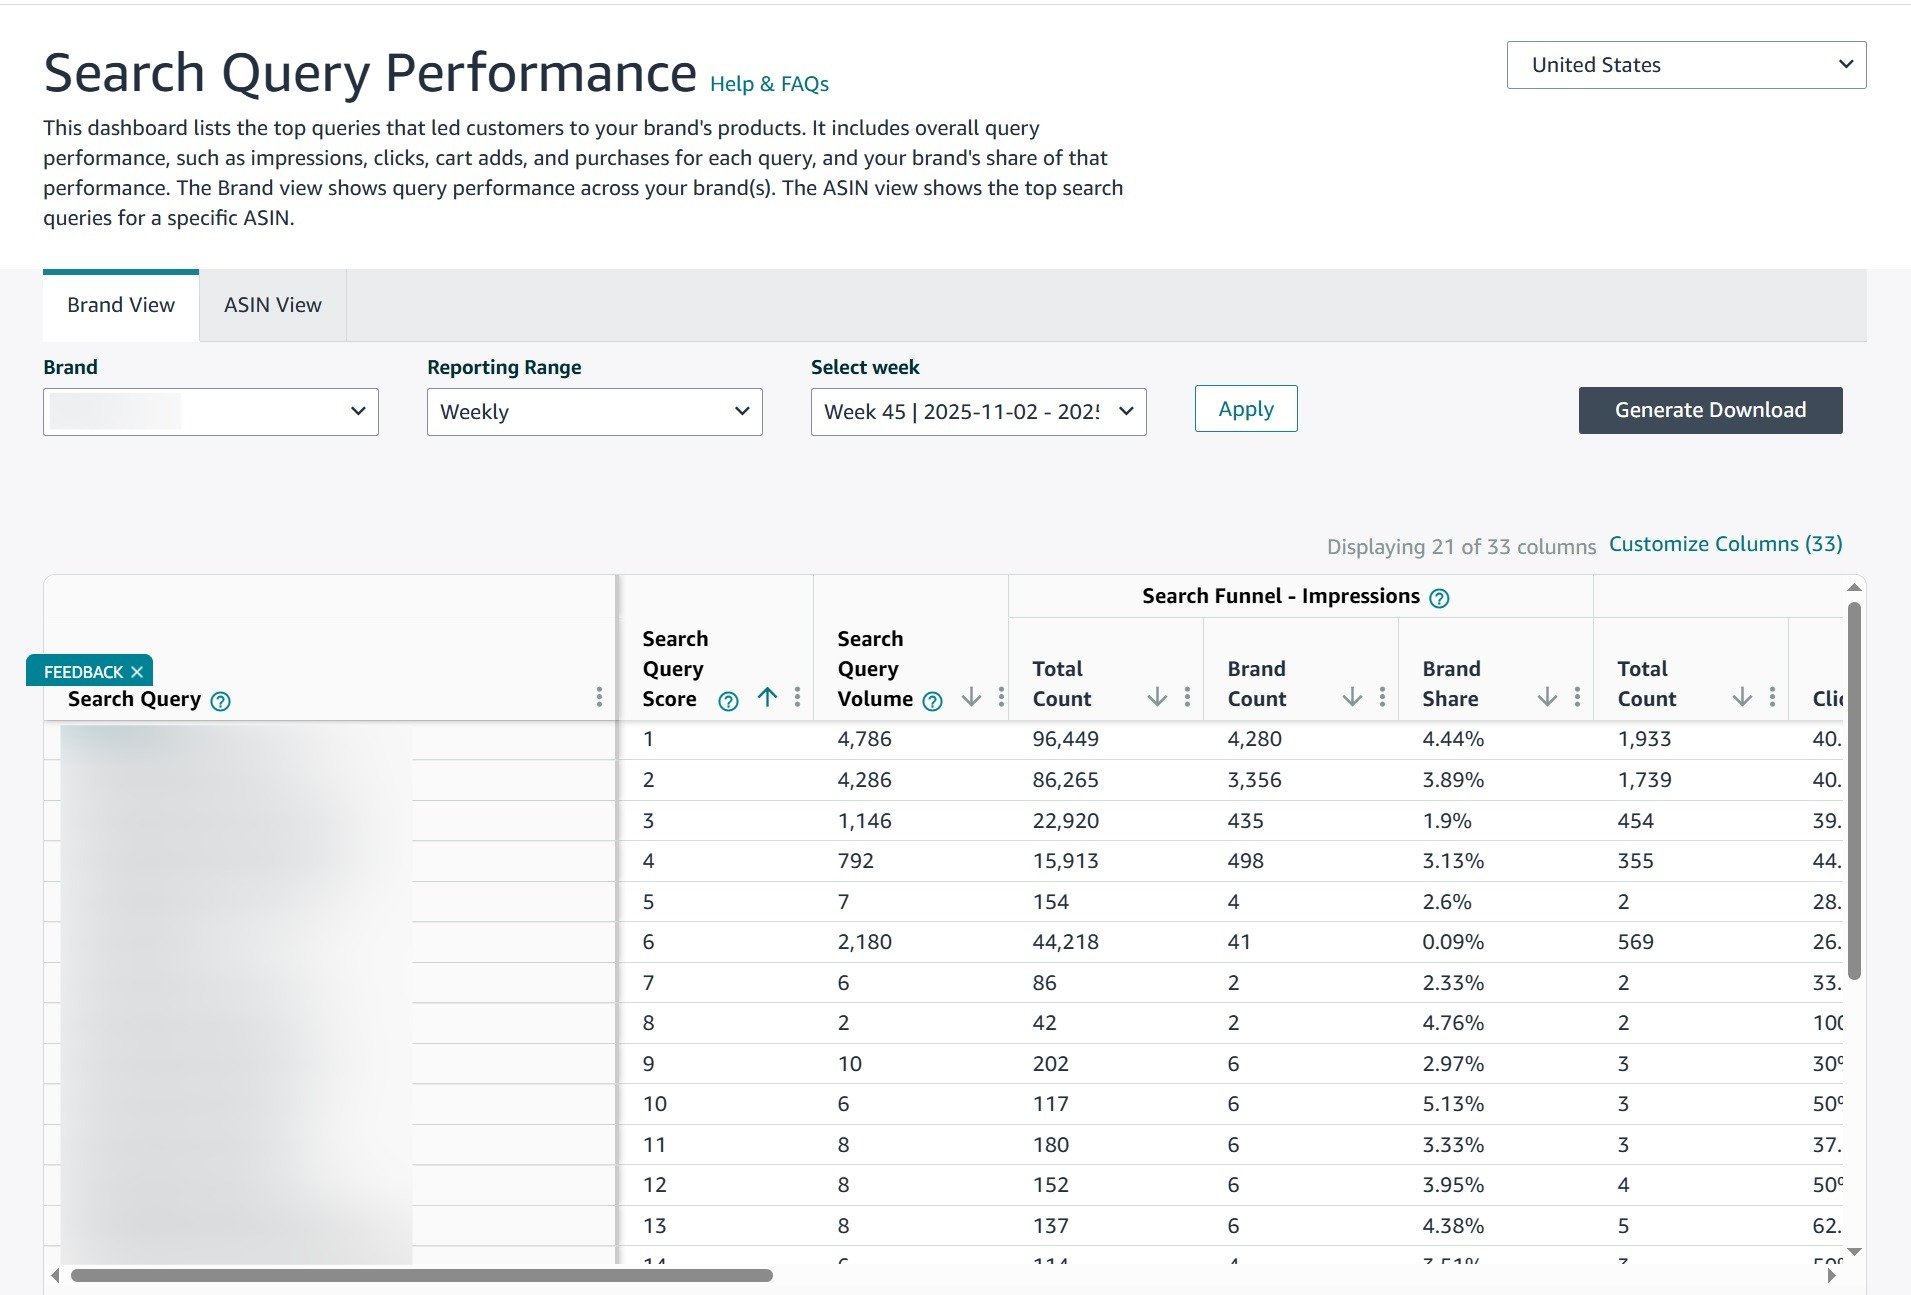
2. Search Query Performance
Ever wondered which search terms are actually driving shoppers to your products and how well they convert? The Amazon Query Performance report shows the search queries that bring customers to your listings, along with clicks, conversions, and revenue generated.
This information can help you:
- Create Targeted Listing Optimizations: If certain queries generate clicks but few sales, you can tweak your titles, bullets, and descriptions to better match customer intent and improve conversions.
- Discover New Keywords: Identify high-traffic search terms your competitors rank for but you don’t, giving you opportunities to expand your keyword strategy and capture more demand.
- Track Click-Through Rate (CTR): Monitor how often shoppers click on your listing after searching for a term. Low CTR indicates your title, image, or main offer may need improvement.
- Measure Conversion Rate: See which search terms actually lead to purchases. If a keyword has high traffic but low conversions, adjust your listing content or images to better drive sales.
- Monitor Keyword Trends: Track shifts in CTR and conversion for specific queries to understand seasonal demand, the impact of promotions, or the effect of listing changes.
This report helps you understand which search queries bring traffic and sales, track performance metrics like CTR and conversion rate, and make data-driven changes to optimize listings and ad campaigns.
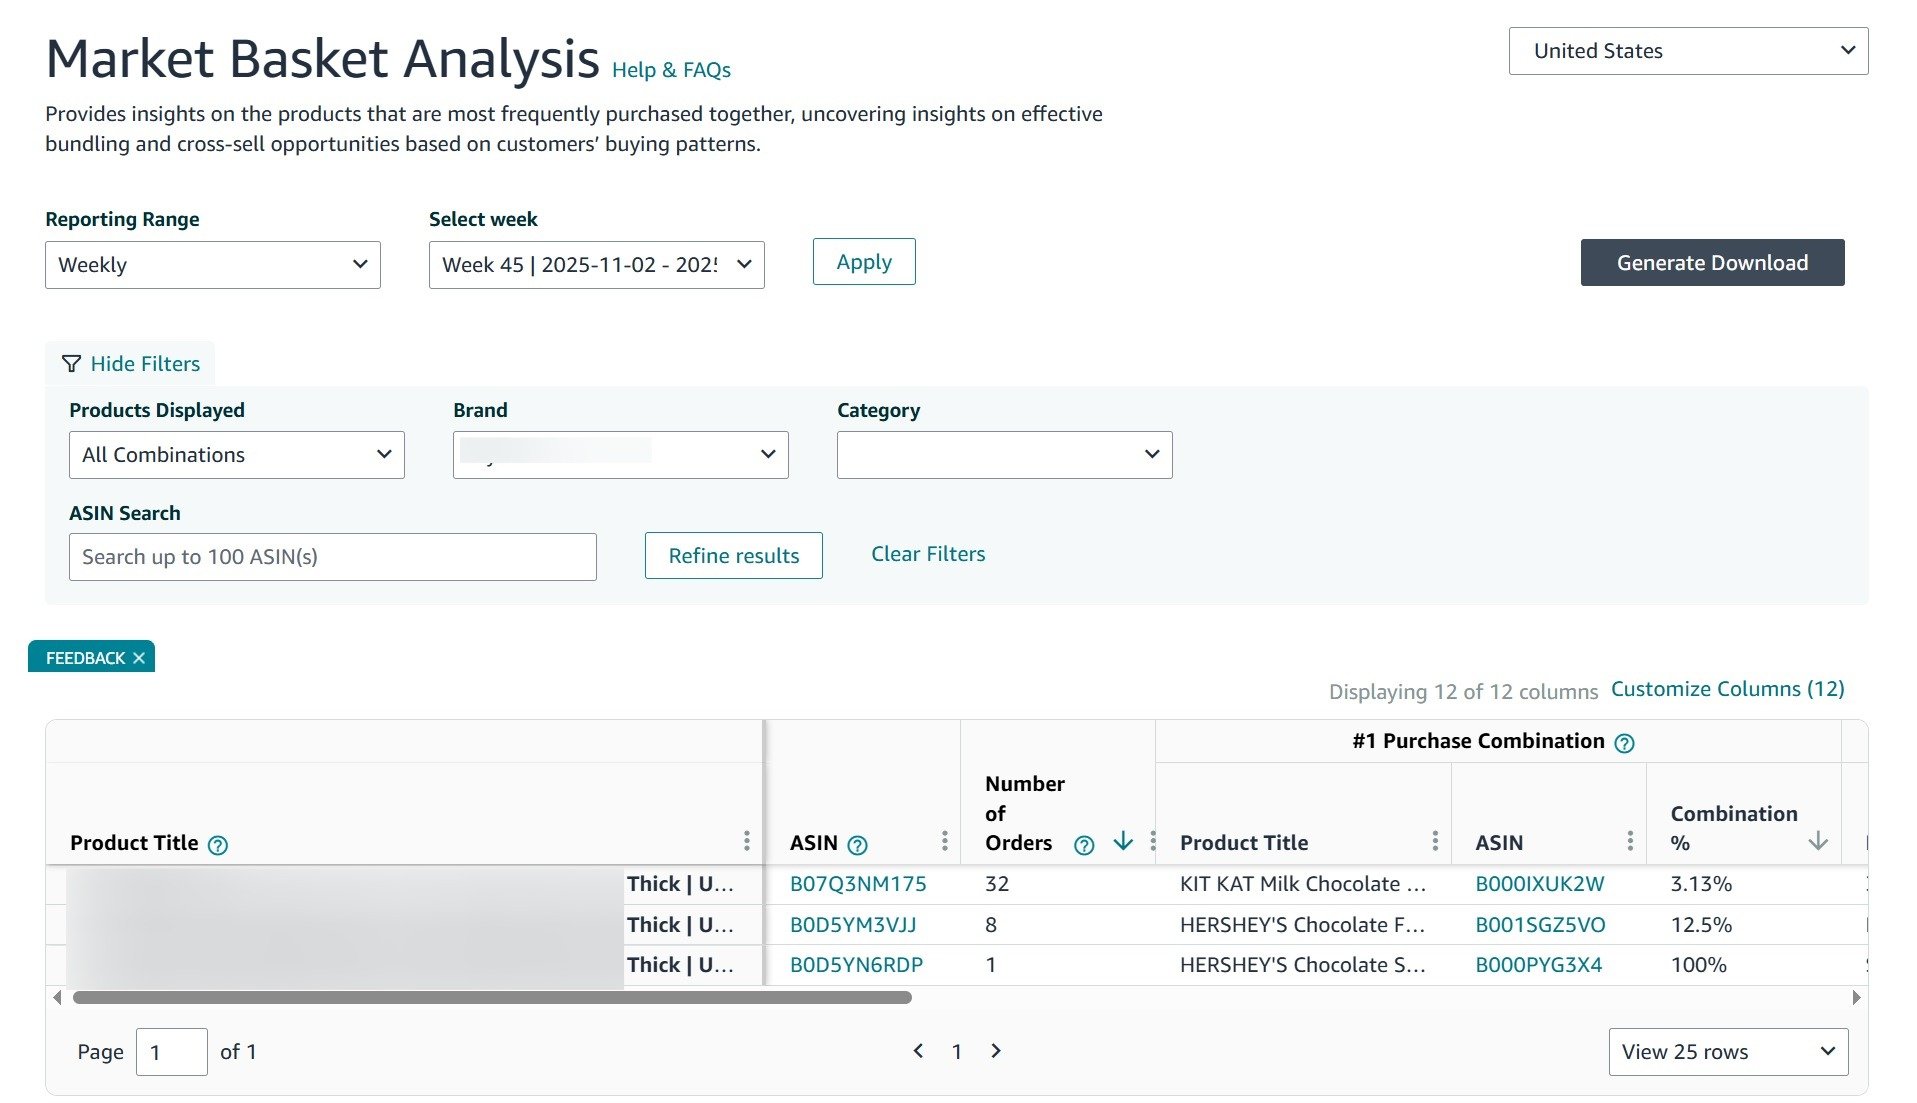
2. Market Basket Analysis
Ever wondered what else your customers add to their cart when they buy your product? The Market Basket Analysis report shows you the top three products most frequently purchased at the same time as yours.
This information can help you:
- Create Effective Product Bundles: If customers often buy your coffee beans with a specific brand of coffee filter, consider bundling them together. Bundles can increase your average order value and make your offer more attractive.
- Identify Cross-Selling Opportunities: Use this data to improve your A+ Content and Amazon Storefront. If you know people buy your yoga mat with a certain yoga block, feature that block on your product page.
- Improve Your PPC Targeting: Run product targeting ad campaigns that place your product on the detail pages of items frequently bought with yours.
This report helps you understand the connections between products and the complete shopping journey.
3. Top Search Terms
The Top Search Terms report shows the most popular search queries on Amazon, ranked by Search Frequency Rank (SFR). The SFR indicates how often a search term is used compared to others in the same category or across the platform, helping you understand what shoppers are actively looking for.
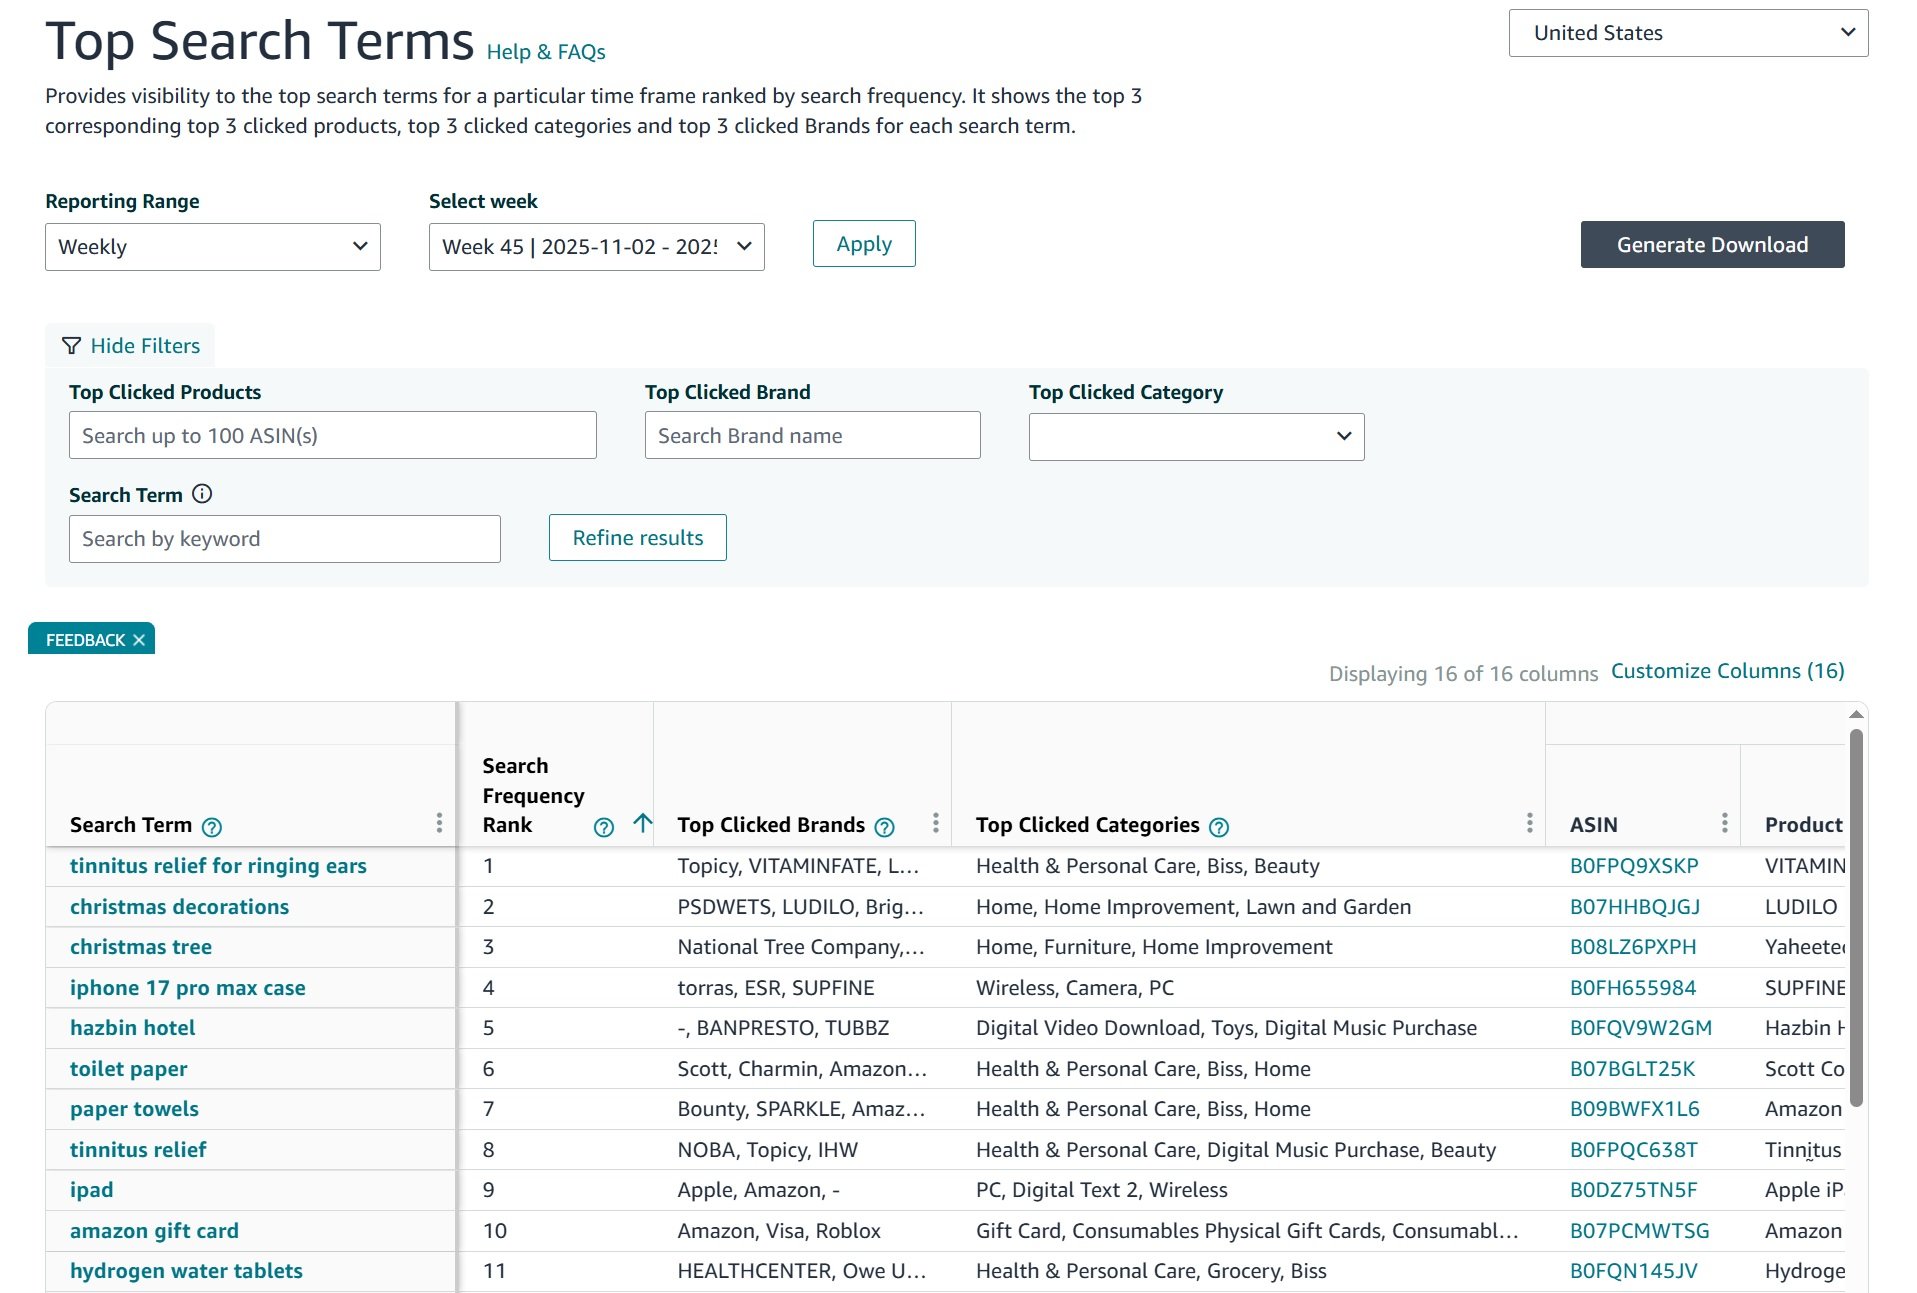
This information can help you:
- Discover Trending Searches: See which terms have the highest SFR and are currently popular among shoppers.
- Identify New Product Opportunities: Find high-demand searches with few matching products to spot potential gaps in the market.
- Search Frequency Rank Insights: Focus on terms with top SFR to optimize listings and campaigns for maximum reach.
This report helps you understand what customers are searching for most on Amazon, giving actionable insights for product research, listing optimization, and strategic advertising.
For brands with large catalogs, many sellers use the Amazon seller tools like Helium10 to automate this analysis.
4. Demographics Report
The Demographics report provides an aggregated, anonymous look at who your customers are. You can see breakdowns by age, household income, education level, gender, and marital status. This helps you build a profile of your ideal customer.
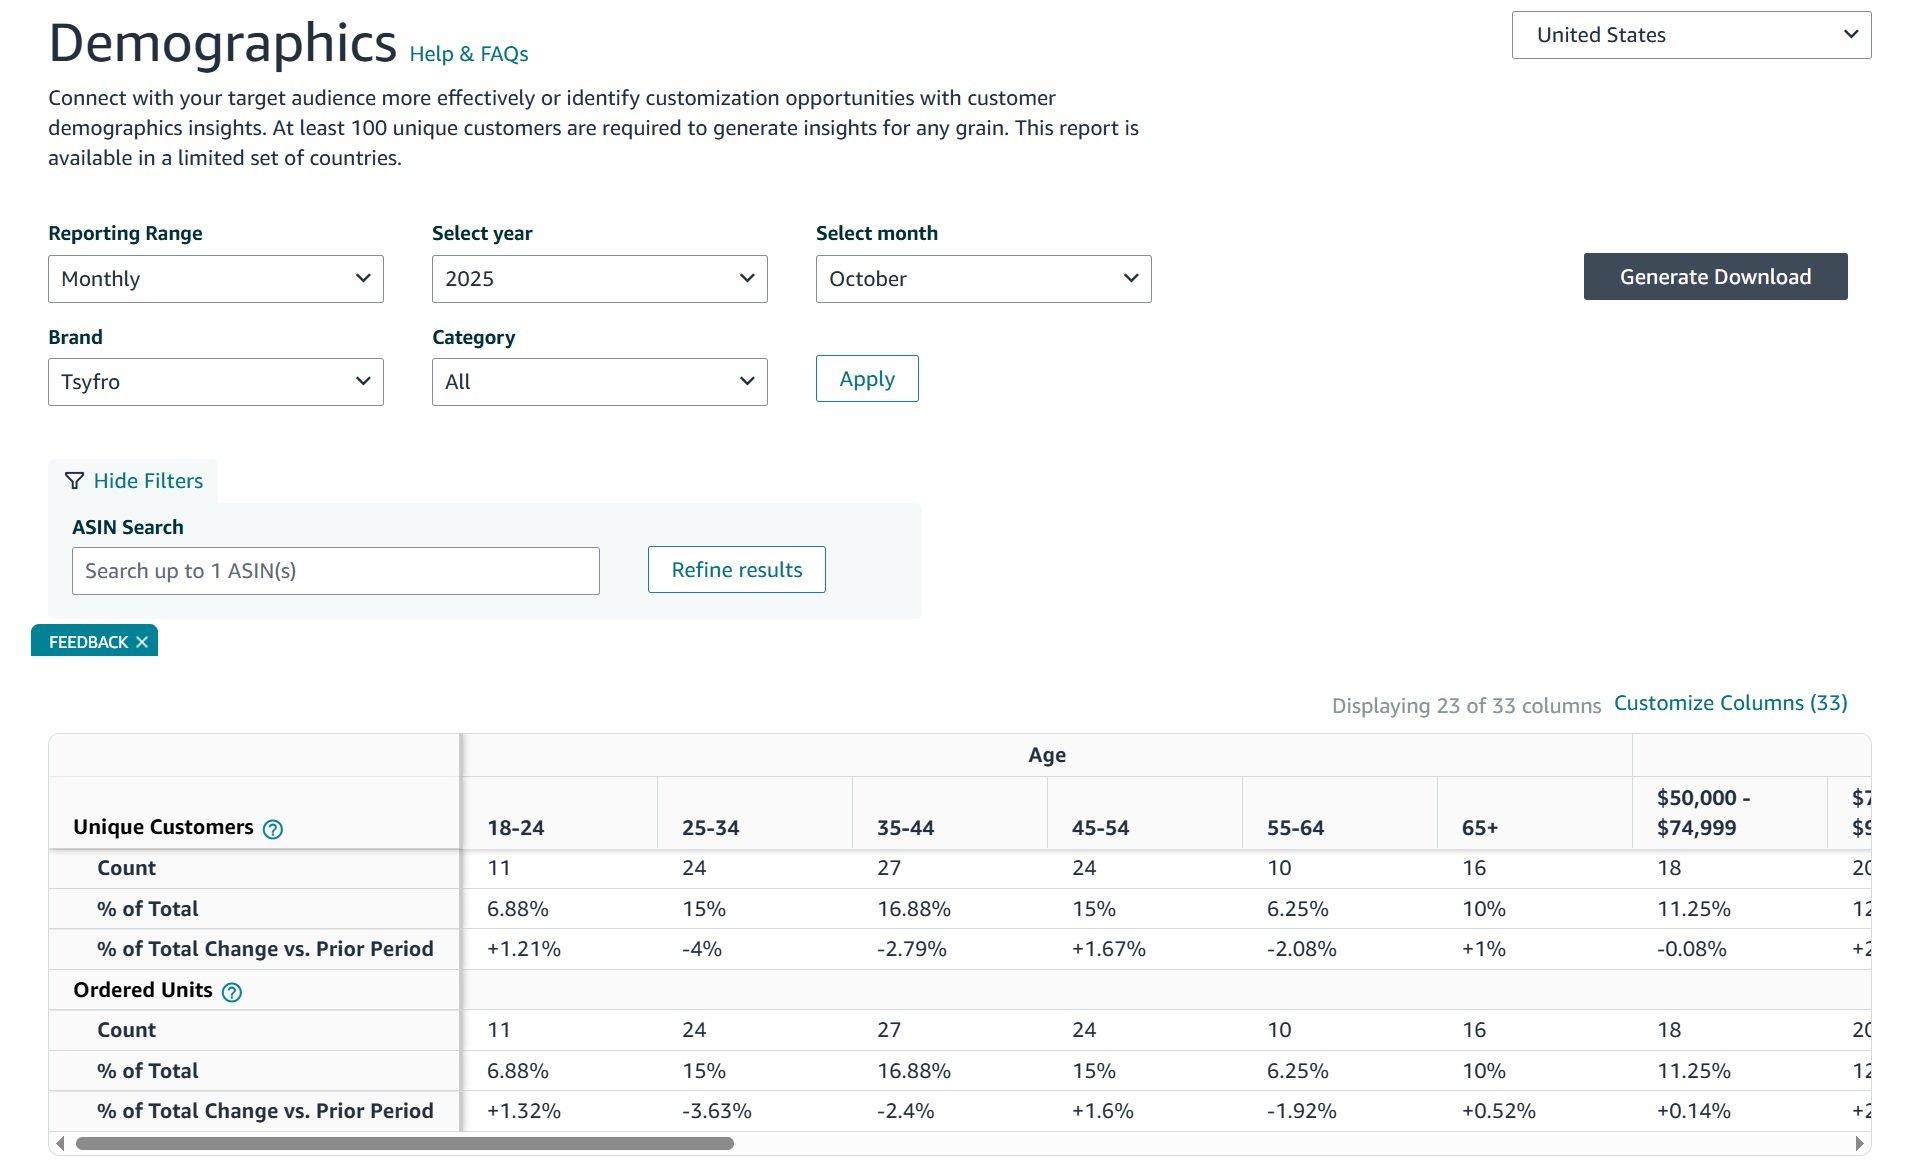
Knowing your audience allows you to:
- Refine Your Marketing Message: You can customize your A+ Content and ad campaigns to connect with your actual buyers. If your customers are primarily in high-income households, you can emphasize your product’s premium features.
- Guide Future Product Development: These insights can help you decide what to create next. If your audience is younger, you might focus on products with modern designs or tech features.
This report helps you understand your audience better, ensuring your brand and products align with the people who are buying them.
Using Data to Improve Your Listings and SEO
Now, let’s focus on what really matters: turning data into higher rankings and more sales. This is where you can actively improve your performance on Amazon.
The Search Query Performance report is your best tool for this. It shows how shoppers interact with your ASINs at every stage of the search journey. It reveals how many impressions your products received for a specific query, how many people clicked, how many added to cart, and how many purchased.
1. Find Keyword Opportunities
Start by looking for queries with high impressions but low Click Share.
If a term generates thousands of impressions and your Click Share is under 0.1–0.2 percent, it means shoppers are seeing the product but not choosing it.
This usually stems from:
- A weak or confusing main image
- A title that doesn’t match the shopper’s intention
- Low search page placement compared to competing ASINs
2. Diagnose CTR Problems
SQP lets you confirm if your CTR is below category expectations.
For example, if a highly product relevant query gives you 50,000 impressions and only 100 clicks, your CTR is 0.2 percent.
If competing items usually sit closer to 1–1.5 percent, your product is losing clicks at the search results stage.
To fix low CTR:
- Test a stronger main image
- Move the most relevant phrase to the start of your title
- Adjust price positioning if you look expensive next to similar items
3. Identify and Fix Conversion Leaks
If CTR looks healthy but conversions are weak, the problem is on the product page.
For example A query drives 3 percent CTR but converts at 3–4 percent in a category that normally converts closer to 10 percent. This gap tells you shoppers were interested but didn’t continue.
Common conversion issues include:
- Pricing that doesn’t compete well
- Low review rating or recent negative reviews
- Weak secondary images
- Missing or incomplete A+ Content
- Variations not organized properly
These adjustments usually improve conversion quickly, and SQP will reflect this through higher Conversion Share.
4. Use SQP to Rebuild PPC Campaigns
SQP reveals which queries already drive engagement and purchases.
Terms with solid CTR and conversions are strong candidates for exact match with higher bids.
Queries with high impressions but poor conversions should stay in broad or phrase, and may need negative exact if they drain spend without producing results.
This approach keeps your campaigns focused on terms that prove their value.
5. Confirm Whether Your Optimizations Worked
SQP is one of the only tools that shows performance changes at the query level, not just at the campaign level.
After updating images, titles, pricing, or A+ Content, compare CTR, Click Share, and Conversion Share before and after the change.
If CTR rises from 1 percent to 1.5 percent or conversions double for a specific term, the SQP data tells you the update was effective.
By identifying these gaps, you can create a list of keywords to add to your product listings. If you want to get more advanced, exploring AI Amazon search optimisation strategies can help you maximize your visibility.
6. Add Keywords to Your Listings
Once you have your list of target keywords, it’s time to use them. Integrate them naturally where they’ll have the biggest impact on Amazon’s A9 algorithm. This isn’t about keyword stuffing, which can make your listing sound robotic. The goal is relevance.
Start with your product title.
Take the top 1-3 most important keywords for your product from Brand Analytics. Make sure at least one is in the first 80 characters of your title. This part of the title is crucial for both SEO and grabbing a shopper’s attention.
Next, update the rest of your listing:
- Bullet Points: Use secondary keywords to highlight features and benefits. Start each bullet point with a capitalized, benefit-focused header to make it stand out.
- Product Description: This is a good place for longer, more specific long-tail keywords. Write it naturally, as if you’re answering your customers’ most common questions.
- A+ Content: Don’t forget the alt-text on your A+ Content images. It’s another place to add relevant keywords and help your media get discovered.
For a complete guide, our article on comprehensive Amazon listing optimization provides more detail on each of these areas.
Analyze the Customer Journey
The Search Catalog Performance report provides a clear view of your shopping funnel for each ASIN. It shows the entire customer journey, from when they see your product in search results to when they click “Buy Now.” Look for drop-off points between each stage:
- Impressions to Clicks (CTR): A low click-through rate suggests your main image, title, or price isn’t competitive enough.
- Clicks to Cart Adds: If people are clicking but not adding to their cart, the issue is likely on your product detail page.
- Cart Adds to Purchases: A large drop-off here could be due to high shipping costs, long delivery times, or last-minute hesitation.
This data-driven approach is essential. Ad spend on Amazon is increasing, with Amazon’s advertising revenue reaching $14.6 billion in Q1 2024. Smart sellers use Amazon Brand Analytics to make every advertising dollar count.
Making Your PPC Campaigns More Effective

Running PPC campaigns without good data is like driving blind. You might be moving, but you’re likely wasting money. Amazon Brand Analytics connects real customer search behavior to your advertising strategy, helping you make smarter, more profitable decisions.
The goal is to stop guessing which keywords convert and start using Amazon’s own data to find them. This can help you lower your Advertising Cost of Sale (ACoS) and ensure your ad spend is effective.
1. Find Keyword Opportunities in SQP Report
The Search Query Performance report is one of the clearest ways to spot which search terms deserve budget and which ones drain money. Instead of guessing which phrases to target, you’re using real shopper behavior tied directly to your ASINs. A simple PPC-focused workflow looks like this:
1.1. Discover High-Value PPC Keywords
Use SQP to filter queries where the impressions are strong but the Click & Conversion Share is low.
This shows you terms shoppers are actively using but your listing is not capturing. Add these phrases to exact or phrase match campaigns and test single keyword ad groups built around them. These keywords usually bring warmer traffic because the report proves customers are already engaging with similar items.
1.2. Identify Search Terms to Block
SQP also shows where your listing gets clicks but never moves into add-to-cart or purchase. It is a clear red flag that the term does not convert for your product. Add those terms as negative exact in your campaigns to stop unnecessary spend.
This approach makes your campaign management proactive. You’re no longer just adjusting bids; you’re improving your targeting based on real customer behavior.
2. Use Competitor Data for Product Targeting Ads
Product Targeting ads, which let you place your ad on a competitor’s product page, are a powerful tool. But which competitors should you target? Brand Analytics can help.
The Item Comparison reports show you which ASINs customers are buying at alongside yours, or buying instead of yours. This is your high-priority target list.
Create a specific Product Targeting campaign that targets these exact ASINs. Since you know shoppers are comparing your product to theirs, placing an ad on their page is a direct way to influence their decision.
This is a data-backed strategy aimed at your biggest competitors. If you’re new to this, understanding what PPC is on Amazon is a good first step before trying these advanced campaigns.
3. Budget Based on Conversion Share
Not all keywords are equal. Some drive clicks, while others drive sales. The Search Query Performance report shows you the conversion share for each keyword.
Use this metric to guide your budget allocation:
- High Conversion Share: If a keyword drives a large percentage of sales in your category, you need to focus on it. Increase your bids and budget on these terms to protect your market share and maximize sales.
- Low Conversion Share: For terms where your conversion share is low, ask why. Is your price too high? Are your reviews weaker than competitors? You might need to improve your offer or reduce ad spend on that term until your listing can compete.
While these Amazon-specific tactics are important, the principles of data-driven advertising apply everywhere. For a broader view, this guide to scaling social media ad campaigns offers useful insights.
Finding New Product and Bundling Ideas

So far, we’ve focused on optimizing your current products. Now, let’s talk about growth. Brand Analytics isn’t just for reviewing past performance; it’s a tool for strategic product development.
These reports provide direct insight into your customers’ needs, guiding your next product launch or revealing simple bundling opportunities to increase your average order value.
1. Find Bundles with Market Basket Analysis
The Market Basket Analysis report is a great tool for creating smart product bundles. It shows you what other products shoppers are buying in the same order as yours. This is a clear sign of what your customers want.
For example, if customers often buy your yoga mat and a specific brand of foam roller at the same time, they’ve already shown you a great bundle idea.
With this information, you can:
- Create Value-Driven Bundles: Combine the top two or three most frequently purchased items into a single package. This makes shopping easier for your customers and increases your average cart value.
- Improve Cross-Selling: Use this data to inform your A+ Content and Amazon Storefront. Feature complementary products on your product pages to encourage add-on purchases.
- Refine PPC Targeting: Set up Product Targeting campaigns aimed at the ASINs you know are bought with yours. You’re reaching customers who are already looking for a solution you can provide.
Bundling products can create a more appealing offer than selling items individually. It solves a customer’s entire problem in one click and helps you stand out from competitors.
2. Research New Product Ideas
Amazon’s Top Search Terms report is a goldmine for discovering new product opportunities. By applying the right filters, you can pinpoint trends, gaps, and high-demand areas with precision.
How to use the filters for actionable product research:
- Top Clicked Products: Enter your own or a competitor’s ASIN to see what search terms are driving clicks and conversions for that product.
- Top Clicked Brands: Enter a brand to see what search terms trigger that brand name.
- Top Clicked Categories: Apply the category filter to understand which subcategories generate the most clicks for a term.
- Search Term Filter: Enter specific keywords to uncover related search terms and variations. Use this to find long-tail ideas, trending products, or potential bundles.
Using these filters systematically allows you to generate data-backed product ideas, rather than guessing what might sell.
This data is valuable for your next product launch or for improving an existing ASIN. It helps you understand what the market wants and what features, prices, and benefits are winning over customers. For more information, check out our guide on the top Amazon product research tools.
With independent sellers making up over 60% of all sales on Amazon, data-driven decisions are more important than ever. The insights from these reports are key to competing effectively.
Frequently Asked Questions
Here are some of the most common questions sellers have about Amazon Brand Analytics, with clear answers.
1. Who Can Use Amazon Brand Analytics?
To use Brand Analytics, you must be enrolled in Amazon Brand Registry. This is a requirement. You need to be the brand owner (or an authorized agent) and have a registered, active trademark.
Once your Brand Registry application is approved, the Brand Analytics suite will appear in your Seller Central or Vendor Central account. It’s completely free to use.
2. How Reliable Is the Data in Brand Analytics?
The data is very reliable because it comes directly from Amazon’s internal systems. You’re not looking at a third-party tool’s estimate; you’re seeing a direct reflection of what real shoppers are searching for and buying.
However, it’s important to understand that all data is aggregated and anonymized to protect individual customer privacy. You won’t see exact numbers like “10,542 people searched for this last month.” Instead, you get metrics like Search Frequency Rank, which shows how popular a keyword is relative to all other search terms on Amazon. It’s more of a tool for spotting trends and comparing to the competition than a volume counter.
3. How Often Should I Check My Brand Analytics Reports?
Having a consistent schedule is key. Here’s a practical routine that many experienced sellers follow:
- Weekly Checks: A quick look once a week is good for making small adjustments. You can monitor your PPC campaigns, spot new search trends, and check on your top products. This keeps you agile.
- Monthly and Quarterly Reviews: For big-picture strategy, you need to zoom out. Analyzing the data on a monthly or quarterly basis helps you identify significant market shifts, plan your long-term SEO strategy, and make better decisions about inventory and new product development.