Most Amazon sellers obsess over ACoS. They optimize bids, tweak keywords, celebrate when ACoS drops from 35% to 28%, and panic when it creeps back up.
But ACoS only tells half the story. It measures how efficiently your ads generate ad-attributed sales. It says nothing about what those ads are doing for your business overall.
That’s where TaCoS comes in.
TaCoS (Total Advertising Cost of Sale) measures your total ad spend as a percentage of your total revenue, not just the revenue tied to ad clicks. It shows whether your advertising is building a sustainable business or just buying temporary traffic.
If you’ve been making PPC decisions based on ACoS alone, you’re likely either overspending on campaigns that look bad but are actually fueling organic growth, or cutting campaigns that were quietly doing the heavy lifting.
This article breaks down exactly how TaCoS works, how to calculate it, what realistic benchmarks look like across categories and product stages, and how to use it to make better advertising decisions in 2026.
What Is Amazon TaCoS?
TaCoS stands for Total Advertising Cost of Sale. Worth noting: this is not an official Amazon metric. You won’t find it labeled anywhere in Seller Central or the Amazon Ads console. It’s an industry-created KPI that Amazon sellers, agencies, and PPC tools have adopted because it fills a gap that ACoS can’t.
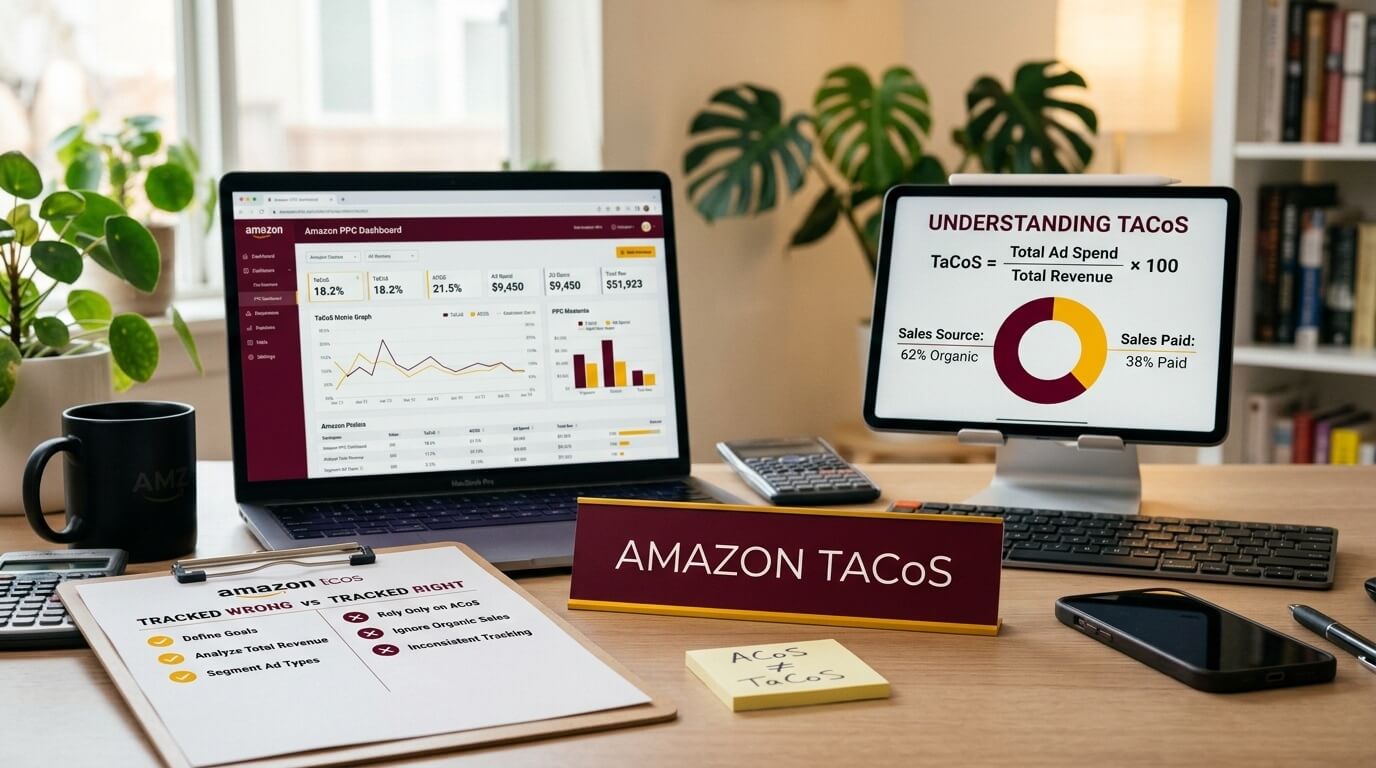
The formula:
TaCoS = (Total Ad Spend / Total Revenue) x 100
Total ad spend means everything you spent on Sponsored Products, Sponsored Brands, and Sponsored Display combined. Total revenue means all sales for that product or account, including organic sales, ad-attributed sales, repeat purchases, and sales driven by external traffic.
Let’s understand it with a simple example. You spend $2,000 on Amazon ads in March. Your total revenue that month, across all sales channels within Amazon, is $20,000.
TaCoS = ($2,000 / $20,000) x 100 = 10%
Ten cents of every dollar you earned went to advertising. The other 90 cents came in without a direct ad cost attached to it.
TaCoS vs ACoS vs ROAS
These three metrics get mixed up constantly. Here’s what each one actually answers.
| Metric | Formula | What It Answers |
|---|---|---|
| ACoS | Ad Spend / Ad Revenue x 100 | How efficiently are my ads turning clicks into ad-attributed sales? |
| TaCoS | Ad Spend / Total Revenue x 100 | How much of my entire business revenue goes toward advertising? |
| ROAS | Ad Revenue / Ad Spend | For every $1 I spend on ads, how many dollars come back in ad sales? |
Let’s understand it with a simple example. Monthly ad spend: $3,000. Ad-attributed revenue: $10,000. Total revenue (all sales): $30,000.
- ACoS = $3,000 / $10,000 = 30%
- TaCoS = $3,000 / $30,000 = 10%
- ROAS = $10,000 / $3,000 = 3.33x
That 30% ACoS might make you want to cut campaigns. But the 10% TaCoS tells a completely different story. For every dollar of ad-attributed revenue, there are two more dollars in organic revenue flowing in alongside it. Your ads aren’t just generating clicks. They’re building organic sales momentum that ACoS completely misses.
This is why sellers who manage PPC for more than a few months start watching TaCoS trends more closely than individual ACoS numbers.
Why TaCoS Matters More Than ACoS
ACoS has a fundamental blind spot. It only measures the direct, last-click relationship between ad spend and the sales Amazon attributes to that ad. It ignores everything else your ads do.
1. Sales Velocity and Organic Ranking
Amazon’s A10 algorithm heavily weighs sales velocity. When ads drive more sales, your product climbs in organic search results, which generates additional organic sales at zero ad cost. ACoS doesn’t reflect this. TaCoS does.
2. Brand Recognition
Sponsored Brands campaigns put your logo and brand name in front of shoppers. Many of those shoppers don’t click the ad but search for your brand later. That sale shows up as organic. ACoS misses it. TaCoS catches it.
3. Review Accumulation
More ad-driven sales mean more opportunities for reviews. More reviews improve conversion rate on both paid and organic traffic. Again, this benefit shows up in TaCoS, not ACoS.
4. Repeat Purchases
A customer discovers your product through an ad, buys it, likes it, and buys it again three months later organically. ACoS attributed only the first sale. TaCoS reflects the full revenue picture.
A falling TaCoS over time is one of the strongest signals that your advertising strategy is working. It means your total revenue is growing faster than your ad spend. Your ads are building organic momentum, and your business is becoming less dependent on paid traffic.
What’s a Good TaCoS?
This depends on three things: where your product is in its lifecycle, what category you’re in, and what your profit margins look like.
By Product Lifecycle
| Stage | Typical TaCoS | Context |
|---|---|---|
| Launch (0-6 months) | 15-30%+ | Heavy ad investment to build reviews, ranking, and visibility. Organic sales are minimal or nonexistent. |
| Growth (6-18 months) | 10-15% | Organic sales picking up. Ad spend may stay similar, but it represents a smaller share of growing total revenue. |
| Mature (18+ months) | 5-10% | Strong organic ranking. Ads maintain position and defend against competitors. |
| Decline or high competition | 12-20%+ | Organic ranking slipping, new competitors entering, or seasonal category pressure. |
By Category (General Ranges)
| Category | Typical TaCoS Range |
|---|---|
| Supplements and Health | 12-25% |
| Beauty and Personal Care | 10-18% |
| Home and Kitchen | 8-15% |
| Electronics and Accessories | 8-15% |
| Grocery and Gourmet | 10-18% |
| Pet Supplies | 10-15% |
| Clothing and Apparel | 12-20% |
| Sports and Outdoors | 8-14% |
| Toys and Games | 8-14% |
These are reference points, not rules. A supplement brand with 70% gross margins can afford a 20% TaCoS and still clear a healthy profit. An electronics accessory seller with 25% margins at the same TaCoS is losing money.
Always pair TaCoS with your actual margin numbers before deciding if yours is “good” or “bad.”
How to Calculate TaCoS Step by Step
Amazon doesn’t display TaCoS anywhere. You need data from two separate places.
Step 1: Pull Your Total Ad Spend
Go to the Amazon Ads console at ads.amazon.com, or navigate through Seller Central by clicking Menu > Advertising > Campaign Manager. Set your date range (weekly or monthly is best for tracking) and note the total spend across all campaign types: Sponsored Products, Sponsored Brands, and Sponsored Display.
Add them all together. If you spent $1,800 on Sponsored Products, $600 on Sponsored Brands, and $400 on Sponsored Display, your total ad spend is $2,800.
Step 2: Pull Your Total Revenue
In Seller Central, go to Menu > Reports > Business Reports. Select Detail Page Sales and Traffic by ASIN if you want per-product TaCoS, or the broader sales summary for account-level TaCoS. Set the exact same date range. Look at the “Ordered Product Sales” column.
This figure includes all revenue: ad sales, organic sales, everything.
Step 3: Calculate
TaCoS = ($2,800 / $24,500) x 100 = 11.4%
Amazon uses different attribution windows for different campaign types. Sponsored Products uses a 7-day click attribution window. Sponsored Brands and Sponsored Display use 14-day windows. This means a click on Monday might show a sale attributed the following week. For TaCoS tracking, using weekly or monthly windows smooths out this lag enough to be reliable. Daily TaCoS numbers will be noisy and often misleading.
Reading TaCoS Trends
A single TaCoS percentage on its own is just a snapshot. The trend over weeks and months is where the insight lives.
1. Decreasing TaCoS
This is the goal for most sellers. It means total revenue is growing faster than ad spend. Your ads are driving sales velocity, improving organic rank, and your business is becoming less reliant on paid traffic. The flywheel is working.
2. Increasing TaCoS
Usually a warning sign, but you need to diagnose the cause before reacting. Ask these questions in order:
- Did my ad spend go up? If yes, was it intentional (new campaign, higher bids) or unintentional (broad match bleed, runaway auto campaigns)?
- Did my total revenue go down? Check your organic sales specifically. If organic revenue dropped while ad spend stayed flat, that’s what’s pushing TaCoS up.
- Did my conversion rate change? Check the Unit Session Percentage in Business Reports. A drop in conversion inflates both ACoS and TaCoS.
- Did CPC increase? More competition for your keywords can raise costs without improving results.
3. Flat TaCoS
Your business is in maintenance mode. Ad spend and revenue are moving at the same pace. Not bad, but it suggests ads aren’t building additional organic momentum. You might be at a ceiling that requires a strategy change, like launching new keywords, testing Sponsored Brands video, or improving your listing to lift conversion rate.
When Rising TaCoS Is Expected
Not every TaCoS increase is a problem. These situations make a rising TaCoS perfectly rational:
1. Product Launches
A new ASIN has zero organic presence. You’re spending heavily to generate initial sales, build reviews, and establish ranking. TaCoS of 25-40% in the first two months is normal. If you see it start declining by month three or four, the launch is on track.
2. Pre-Peak Season Investment
Many sellers increase ad spend in September and October to build organic ranking before the Q4 holiday surge. TaCoS goes up temporarily, but the payoff comes when high-volume November and December sales bring it back down and then some.
3. New Keyword Expansion
Targeting new keyword clusters or moving into adjacent subcategories means spending on unproven search terms. TaCoS will spike until you identify the winners and cut the losers.
4. Deliberate Market Share Grab
Some sellers accept short-term TaCoS increases as the price of pushing competitors down in ranking. This requires cash flow and a clear timeline for when you expect TaCoS to normalize.
The question isn’t whether TaCoS went up. It’s whether you know why and whether the reason aligns with a strategy you can afford.
How to Lower Your TaCoS
Two levers: spend less on ads, or earn more total revenue. The best approaches pull both simultaneously.
1. Grow Organic Sales
This is the single most effective long-term TaCoS lever. When organic revenue increases without additional ad spend, TaCoS drops by definition.
Practical ways to do this:
- Optimize your listing. Rewrite your title to include your highest-volume keywords naturally. Upgrade bullet points to address buyer hesitations. Add A+ Content with comparison charts and lifestyle images.
- Get more reviews. Use the Request a Review button in Seller Central (Order Details page, available 5-30 days after delivery). Enroll in Amazon Vine if you have fewer than 30 reviews for new product launches.
- Improve conversion rate. Better main image, competitive pricing, and answering common questions in your listing all lift Unit Session Percentage. Every point of conversion improvement means more sales from the same traffic.
- Run promotions strategically. Coupons, Lightning Deals, and Best Deals drive temporary sales spikes that can boost organic ranking. The ranking improvement often persists after the promotion ends.
2. Cut Wasted Ad Spend
Go to Advertising > Reports in the Amazon Ads console (or Seller Central > Advertising > Reports) and download your Search Term Report for the last 60 days.
Look for:
- Search terms with ad spend greater than 50% of product price and zero sales. Add these as negative exact keywords.
- Search terms with extremely high ACoS (over 100%) that aren’t strategically important. Lower bids or negate.
- Auto campaign search terms that are irrelevant to your product. Add as negative keywords.
Cleaning up wasted spend once per month typically saves 10-20% of ad budget without reducing meaningful sales.
3. Shift Budget Toward High-Converting Placements
In Campaign Manager, click on any campaign and go to the Placements tab. You’ll see performance broken down by Top of Search, Product Pages, and Rest of Search.
Top of Search placements typically convert 2-3x better than other placements. If your data confirms this pattern, use the percentage adjustment to bid higher for Top of Search. You’ll pay more per click, but the higher conversion rate usually delivers better overall efficiency.
4. Structure Campaigns for Control
If you’re running a single auto campaign with everything lumped together, you have very little control. A better structure:
- Auto campaign for keyword discovery (low bids, mining search terms)
- Broad match campaign for medium-intent keywords
- Exact match campaign for your proven, highest-converting keywords (highest bids)
This lets you funnel budget toward what works and starve what doesn’t.
5. Prioritize High-Margin ASINs
If you sell 15 products, calculate TaCoS for each one. You’ll almost certainly find that a few products are dragging the average up while others are performing well. Shift ad budget toward products where your margin can absorb the ad cost and still deliver profit.
TaCoS and the Flywheel Effect
Amazon’s ranking system rewards products that sell consistently. More sales lead to better organic ranking. Better ranking leads to more visibility. More visibility leads to more organic sales without additional ad cost.
Advertising is the engine that starts this flywheel. The cycle works like this:
- Ad spend drives paid sales
- Paid sales increase total sales velocity
- Higher velocity improves organic search ranking
- Better organic ranking generates organic sales (zero ad cost)
- Total revenue grows while ad spend stays flat or grows slower
- TaCoS decreases
When you see TaCoS trending down over months, this is usually what’s happening. Your ads invested in the flywheel, and now the flywheel is paying you back with organic revenue.
Sellers who optimize purely on ACoS often accidentally kill this cycle. They see a campaign with 40% ACoS and pause it, not realizing it was the campaign driving enough sales velocity to maintain page-one organic ranking. Two weeks later, organic sales drop, total revenue falls, and TaCoS actually goes up even though ad spend went down.
This is why TaCoS is the better strategic metric. It forces you to look at the full picture.
TaCoS and Profitability
Here’s a scenario to illustrate why TaCoS needs to be read alongside profit, not instead of it.
Product: Stainless steel water bottle
Selling price: $24.99
COGS: $5.50
Amazon fees (referral + FBA fulfillment): $9.25
Gross profit per unit before advertising: $10.24
Scenario A: TaCoS at 12%
Monthly ad spend: $3,600. Total revenue: $30,000. Units sold: 1,200.
- Total gross profit: $10.24 x 1,200 = $12,288
- Profit after ads: $12,288 – $3,600 = $8,688
Scenario B: TaCoS at 8%
Monthly ad spend: $1,800. Total revenue: $22,500 (organic sales dropped because of reduced ad support). Units sold: 900.
- Total gross profit: $10.24 x 900 = $9,216
- Profit after ads: $9,216 – $1,800 = $7,416
TaCoS looks better in Scenario B. But you made $1,272 less in actual profit.
This is a trap that catches a lot of sellers. A lower TaCoS isn’t automatically better if it came at the cost of revenue and profit. The goal is the right TaCoS for your situation, where you’re spending enough to maintain momentum but not so much that profit disappears.
Common TaCoS Mistakes
1. Checking TaCoS Daily
Daily data is too volatile. One large organic order or one day of paused campaigns will swing TaCoS dramatically. Stick to weekly minimums.
2. Comparing Your TaCoS to Someone Else’s
A seller in the supplements category with 65% margins and a seller in electronics with 20% margins can both be profitable at wildly different TaCoS levels. Category, margins, and business goals all make comparisons misleading.
3. Using Account-Level TaCoS Only
Your account-level TaCoS might be 11%. But dig deeper and you might find one product at 5% carrying two others at 22% and 30%. Always calculate TaCoS per ASIN to find what’s actually working and what’s draining your budget.
4. Ignoring Seasonality
Comparing your TaCoS in January (typically lower demand, higher CPCs, lower conversion) to TaCoS in November (peak demand, higher conversion) will give you misleading signals. Compare the same months year over year when possible.
5. Chasing the Lowest Possible TaCoS
A TaCoS under 3-4% might seem ideal, but it often means you’re underinvesting. Competitors are outspending you, slowly eroding your organic position. By the time you notice the ranking decline, recovering it costs far more than maintaining it would have.
Tracking TaCoS: A Simple Weekly Framework
You don’t need expensive software. A spreadsheet works.
| Week | Ad Spend | Total Revenue | Ad Revenue | TaCoS | ACoS | Organic % | Notes |
|---|---|---|---|---|---|---|---|
| Mar 3-9 | $1,200 | $8,500 | $4,100 | 14.1% | 29.3% | 52% | Launched phrase match campaign |
| Mar 10-16 | $1,350 | $9,200 | $4,500 | 14.7% | 30.0% | 51% | Testing higher bids |
| Mar 17-23 | $1,300 | $10,100 | $4,400 | 12.9% | 29.5% | 56% | Organic picking up |
| Mar 24-30 | $1,250 | $10,800 | $4,200 | 11.6% | 29.8% | 61% | Flywheel gaining traction |
The column that matters most alongside TaCoS is Organic %. Calculate it as:
Organic Sales % = ((Total Revenue – Ad Revenue) / Total Revenue) x 100
When organic percentage is rising and TaCoS is falling, your advertising strategy is working. That’s the trend you want to see.
Tools like Helium 10’s Adtomic, Pacvue, Perpetua, and Jungle Scout’s advertising dashboard now display TaCoS natively. But understanding the underlying math makes you a better decision-maker regardless of what tool you use.
Frequently Asked Questions
What does TaCoS stand for in Amazon advertising?
TaCoS stands for Total Advertising Cost of Sale. It measures total ad spend as a percentage of total revenue. It’s not an official Amazon metric but is widely used by sellers, agencies, and PPC software providers to evaluate the overall impact of advertising on business performance.
Is TaCoS the same as ACoS?
No. ACoS (Advertising Cost of Sale) divides ad spend by ad-attributed revenue only. TaCoS divides ad spend by total revenue, which includes organic sales, repeat purchases, and all other non-ad revenue. TaCoS gives a broader picture of advertising’s impact on your entire business.
What TaCoS should I aim for?
There’s no single target. For new products in the first six months, 15-30% is normal. For established products with strong organic ranking, 5-10% is a healthy range. What matters most is that your TaCoS is at a level where you’re still profitable after accounting for product cost, Amazon fees, and ad spend.
Where do I find TaCoS in Seller Central?
You won’t find it displayed anywhere. Amazon does not calculate or show TaCoS. You need to pull total ad spend from the Amazon Ads console (Campaign Manager) and total revenue from Seller Central Business Reports (Ordered Product Sales), then calculate it manually: (Ad Spend / Total Revenue) x 100.
How often should I track TaCoS?
Weekly is the most useful cadence for most sellers. Daily numbers fluctuate too much to be meaningful. Monthly works for big-picture trend analysis. If you’re in a heavy optimization phase or running a product launch, weekly tracking helps you catch shifts early without overreacting.
Why is my TaCoS going up but my ACoS is stable?
This almost always means organic sales are declining. If your ad spend and ad efficiency stay the same but your total revenue drops because of lower organic sales, TaCoS will rise. Check your organic ranking, Best Seller Rank, and Unit Session Percentage in Business Reports to identify the root cause.
Can my TaCoS be too low?
Yes. A TaCoS below 3-4% might mean you’re not investing enough in advertising. This can leave you vulnerable to competitors who are spending to take your organic ranking positions. It can also mean you’re missing growth opportunities in keywords or audiences you’re not targeting.
Should I use TaCoS or ACoS for campaign optimization?
Use both, but for different purposes. ACoS is the right metric for campaign-level decisions: adjusting bids, adding negative keywords, evaluating specific search terms. TaCoS is the right metric for strategic decisions: overall budget allocation, assessing whether advertising is building organic momentum, and evaluating long-term advertising ROI.
How does TaCoS relate to profitability?
TaCoS tells you what percentage of revenue goes to ads, but it doesn’t directly tell you if you’re profitable. You need to know your gross margin (selling price minus product cost minus Amazon fees) to determine your break-even TaCoS. If your gross margin is 40%, any TaCoS below 40% means advertising isn’t eating your entire margin. But you also have other costs (storage, returns, software, etc.), so your real break-even TaCoS is lower.
What’s the difference between TaCoS for Sponsored Products vs Sponsored Brands?
TaCoS is typically calculated using combined ad spend from all campaign types. However, you can calculate it per campaign type if you want to understand which ad format is contributing most to total revenue growth. Sponsored Brands, for example, often have a higher ACoS but can lower overall TaCoS by driving brand awareness that increases organic search volume for your brand name.