
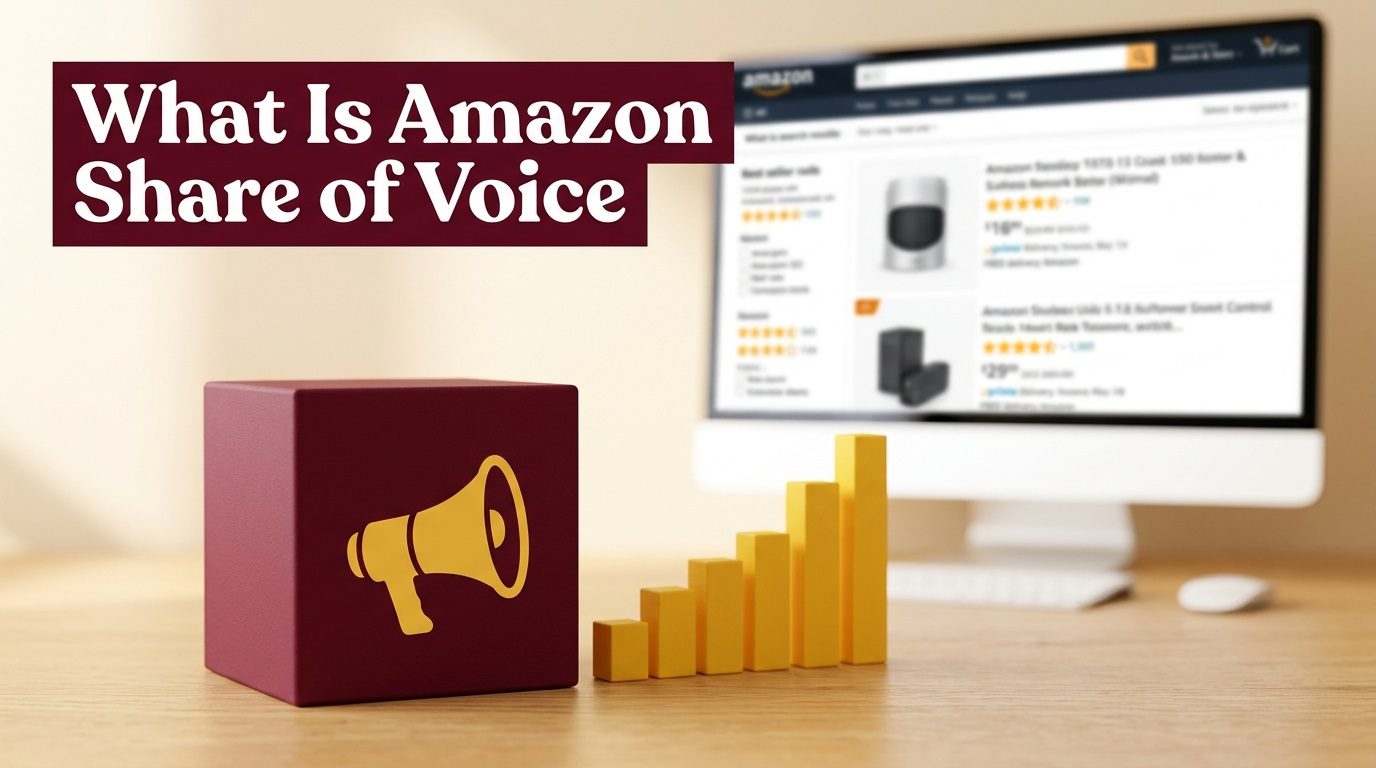
Amazon Share of Voice (SOV) measures how often your brand’s products appear in search results compared to all products competing for the same keywords. It tells you what percentage of the visible ad or organic ranking your listings own across a defined keyword set.
If ten sellers compete for “wireless earbuds” and your ads appear in 3 out of every 10 ad slots across that keyword, your paid share of voice is 30%. Scale that logic across hundreds of keywords, and SOV becomes one of the clearest signals of how much of a category you actually control.
This metric sits at the intersection of visibility, competitiveness, and revenue. Brands that dominate SOV on Amazon consistently outperform those that track only ACOS or conversion rate, because SOV is a leading indicator. It tells you where you stand before the sales data catches up.
How Amazon Share of Voice Actually Works
Amazon does not hand sellers a single SOV score. The metric is constructed, either through Amazon’s own advertising tools, third-party software, or manual tracking. Understanding what SOV captures, and what it misses, determines how useful the number actually is.
Share of Voice on Amazon refers to the percentage of impressions, placements, or search result appearances your brand owns across a target keyword set, relative to the total available placements.
The formula is straightforward:
SOV = (Your Brand Impressions or Placements / Total Category Impressions or Placements) × 100
Run this across 50 keywords in your category and you get a category-level SOV figure that actually means something.
1. Paid vs. Organic Share of Voice
SOV on Amazon splits into two distinct lanes, and conflating them leads to bad decisions.
Paid SOV tracks how frequently your Sponsored Products, Sponsored Brands, and Sponsored Display ads appear across your target keywords relative to competitors. Amazon’s Brand Analytics and third-party tools like Helium 10, Jungle Scout, and DataHawk can surface this at scale.
Organic SOV tracks where your listings rank in unpaid results. A brand can run zero ads and still own 40% organic SOV if its listings rank in positions 1 through 5 for competitive keywords. That is harder to build but far more durable than paid placement.
Most brands are strong in one and weak in the other. The ones winning categories are usually competitive in both.
2. Impression Share Inside Amazon Advertising
Inside Amazon Ads, the closest native equivalent to SOV is Impression Share, which is available at the campaign and keyword level. It shows what percentage of eligible impressions your ads actually captured.
If your Impression Share on “running shoes” is 22%, competitors claimed the remaining 78%. A low Impression Share combined with a high budget usually points to bid competitiveness. A low Impression Share with budget remaining often signals relevance or quality score issues.
Amazon updated its advertising console reporting in 2024 to include more granular impression share data by placement type, including top-of-search, rest-of-search, and product pages. This matters because top-of-search SOV carries significantly more commercial weight than the other placements.
Why Share of Voice Matters More Than Most Amazon Metrics
Most sellers obsess over ACoS, TACo, Sconversion rate, and BSR. These are output metrics. They tell you what already happened. Share of Voice is a competitive position metric. It tells you where you stand right now, relative to everyone else fighting for the same buyer.
1. SOV Predicts Revenue Before Revenue Moves
In saturated categories, SOV shifts precede revenue shifts by two to four weeks. When a competitor’s SOV climbs on your top keywords, their impressions are going up, their click volume is growing, and their conversion data is accumulating. By the time their BSR improves and their sales velocity is visible, they have already taken share from you.
2. SOV and the Amazon Flywheel
Amazon’s A9 and A10 algorithm rewards velocity. More clicks and conversions signal relevance, which pushes organic rankings up, which generates more clicks without ad spend. Share of Voice is the mechanism through which this flywheel starts.
High paid SOV drives click volume and sales velocity. That velocity feeds organic ranking. Stronger organic ranking produces organic SOV. The two reinforce each other, and SOV is the metric that shows whether the flywheel is spinning or stalling.
3. Category SOV Benchmarks Worth Knowing
Across competitive Amazon categories in 2025, the top three brands typically account for 55 to 70% of total paid SOV on primary keywords. In less competitive or newer categories, a single brand can achieve 30 to 40% SOV with a focused keyword strategy and a monthly ad budget well below $20,000.
The average click-through rate for a Sponsored Product ad in the top-of-search position is roughly 0.35 to 0.40%, compared to 0.10 to 0.15% for rest-of-search placements. This means top-of-search SOV is not just a visibility play. It delivers disproportionate traffic relative to its share of total placements.
How to Measure Amazon Share of Voice
Measuring SOV well requires a repeatable system. Here is how to measure Amazon SOV.
1. Define Your Keyword Universe First
Before measuring anything, you need a keyword list that represents your category. This is not your full keyword list. It is the 30 to 150 keywords that genuinely drive purchase decisions in your niche.
Include your primary category terms, competitor brand terms if you are bidding on them, and any keywords where you know your main competitors are concentrating spend.
2. Use Amazon Brand Analytics for Baseline Data
Amazon Brand Analytics, available to brand-registered sellers through Seller Central, provides “Top Search Terms” Report data that includes the top three clicked products and their click share and conversion share for any search term.
This is as close to official SOV data as Amazon provides organically. A product with a 30% click share on a given search term owns roughly 30% of the clicks on that term, which is a strong proxy for paid plus organic SOV combined.
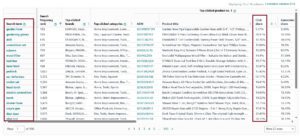
The limitation is that Brand Analytics shows historical data on a weekly, monthly, or quarterly basis. It is useful for trend analysis but not for real-time competitive monitoring.
3. Third-Party Tools and What They Measure
Tools like Helium 10’s Market Tracker 360, DataHawk, Perpetua, and Pacvue track SOV across custom keyword sets. Each has slightly different methodology.
Helium 10 Market Tracker 360 crawls Amazon search results at defined intervals and records which ASINs appear at which positions. It calculates share of voice as the percentage of tracked keyword appearances your products account for. The tracking frequency and keyword set size you configure directly determine accuracy.
Pacvue and Perpetua focus primarily on paid SOV, pulling impression share data directly from Amazon’s advertising API. These are more accurate for ad-specific SOV but miss organic performance entirely.
DataHawk combines organic rank tracking with advertising data to produce a blended SOV metric across both channels, which is useful for brands that want to see the total competitive picture in one number.
4. Manual SOV Tracking for Smaller Budgets
If third-party tools are out of budget, manual tracking still produces usable data. Search each target keyword on Amazon, record which brands appear in the first two pages of results and in the top ad placements, and tally appearances by brand.
Do this consistently at the same time of day and on the same day each week. Amazon personalizes results based on browsing history, so use a browser in incognito mode or a clean device. Over four to six weeks, patterns in brand dominance become clear enough to act on.
Amazon Share of Voice by Placement Type
Not all SOV is equal. Where your brand appears matters as much as how often it appears.
1. Top of Search Sponsored Brands Placement
The banner ad placement at the very top of search results, occupied by Sponsored Brands campaigns, delivers the highest impression volume and strongest brand recall. Brands running video creatives in this placement have reported 30 to 50% higher click-through rates than static image formats in comparable tests.
Owning this placement consistently on your highest-volume keywords creates a category association in buyers’ minds. It signals market leadership even before the buyer clicks anything.
2. Sponsored Products in Positions 1 Through 4
The first four organic-looking ad slots on Amazon search results, labeled “Sponsored” but visually identical to organic listings, drive the majority of paid click volume. Impression share in these positions is the most commercially valuable paid SOV to track.
Amazon data from 2024 indicates that the top-of-search ad placement captures approximately 35% of all ad clicks for a given search query, despite representing only one to four ad slots out of a full page of results. Brands with strong SOV here convert at higher rates because buyer intent at that stage is at its peak.
3. Organic Position SOV
Organic SOV measures how many times your products appear in the top 20 organic positions across your keyword set, relative to how many times any product appears. A brand with five products ranked in the top 10 across 40 keywords has meaningfully higher organic SOV than a brand with one hero product ranked number 1.
This is why depth of catalog matters in SOV strategy. Multiple well-ranked listings reinforce each other through brand association and collectively consume more search result real estate.
4. Product Detail Page Placements
Sponsored Display ads running on competitor product detail pages create a different type of SOV. You are not capturing search-intent traffic. You are reaching buyers who are already in category, looking at a competing product, and potentially open to alternatives.
This placement type is often underinvested by brands focused on keyword SOV. In highly competitive categories where keywords are expensive, product page SOV can deliver incremental reach at a lower cost per impression.
Building a Share of Voice Strategy on Amazon
Knowing your SOV number is the starting point. Building a strategy around it is where the actual work happens.
1. Set SOV Targets by Keyword Tier
Not every keyword deserves the same SOV investment. Divide your keywords into three tiers based on search volume, conversion rate, and strategic importance.
Tier 1 keywords are your highest-volume, highest-intent terms where you want dominant SOV, ideally above 25 to 30% paid SOV and top-five organic positioning. These justify premium bids and dedicated Sponsored Brands campaigns.
Tier 2 keywords are important but secondary. Target 10 to 20% paid SOV here. These are often category modifier terms or specific use-case keywords where your product is relevant but competition is lower.
Tier 3 keywords are defensive or exploratory. You want presence without heavy investment. Even 5 to 10% SOV on these terms keeps your brand in the consideration set and prevents a single competitor from completely owning the space.
2. Coordinate Paid and Organic Efforts
A paid SOV push without organic rank support is expensive to sustain. A strong organic position without paid amplification leaves top-of-search real estate to competitors.
The practical approach: use paid SOV aggressively on keywords where your organic rank is between position 5 and 20. You are already relevant enough to convert, but not yet visible enough to drive significant organic traffic. Paid SOV at this stage accelerates the sales velocity that pushes organic ranking upward.
Once organic rank reaches positions 1 through 4, reduce bids on that keyword and redirect budget to keywords still in the 5 to 15 organic range. This approach compounds gains over time instead of requiring perpetual spend to maintain position.
3. Use Competitor SOV Data
SOV drops among your competitors are opportunities. When a competitor reduces ad spend, their paid SOV falls within days. Their organic rank usually holds for two to four weeks before declining, because algorithm updates lag spend changes.
Monitor competitor SOV weekly. When a major category player shows a sustained drop in paid SOV over two or more consecutive weeks, that is a signal to increase your own bid intensity on overlapping keywords. You capture impression share they have vacated before their organic rank erodes and they have incentive to return.
4. New Product Launch and SOV Sequencing
Launching a new ASIN into a competitive category requires a deliberate SOV ramp. Amazon’s algorithm has no sales history to work with, which suppresses organic rank regardless of listing quality.
The sequence that works: concentrate paid SOV on three to five primary keywords in the first four weeks. Do not spread budget across 30 keywords. Drive enough click and conversion volume on a narrow keyword set to build relevance signals before expanding. Sellers who try to own SOV on too many keywords at launch dilute velocity across the board and struggle to rank organically on any of them.
After four to six weeks of concentrated keyword focus, organic rank on those terms typically moves into the top 20. At that point, expand the keyword universe and replicate the concentrated approach on the next tier.
Amazon Advertising Updates Affecting Share of Voice in 2025 and 2026
Amazon made several changes to its advertising infrastructure that directly affect how SOV is distributed and measured.
1. Sponsored TV and Upper-Funnel SOV
Amazon expanded Sponsored TV broadly across the US in 2024 and continued its rollout internationally into 2025. This placement type, which serves ads to Amazon Prime Video and Freevee viewers, adds an upper-funnel layer to SOV that was not available through search advertising alone.
For brands in visually compelling categories, Sponsored TV creates SOV in environments where direct competitors are not yet competing. Early movers in categories like home goods, kitchen equipment, and personal care have reported measurable brand search lift after Sponsored TV campaigns. Brand search lift is a leading indicator that upper-funnel SOV is translating into bottom-funnel search behavior.
2. Performance Plus Campaigns in DSP
Amazon launched Performance Plus campaigns in 2024 as a fully automated campaign type where the algorithm manages targeting, bidding, and creative optimization. These campaigns have access to Amazon’s first-party signals, including shopping behavior, purchase history, and audience segments that manual campaigns do not reach.
For SOV purposes, Performance Plus campaigns in DSP can surface your products in placements outside traditional keyword search, including display, streaming, and browse paths. This expands the definition of SOV beyond search result pages and complicates head-to-head SOV comparisons with competitors who may or may not be using the same campaign types.
3. Amazon Marketing Cloud and SOV Attribution
Amazon Marketing Cloud (AMC) is a clean-room analytics environment where brands can run SQL queries across their advertising and purchase event data. As of 2025, AMC allows brands to analyze the overlap between their paid impressions and organic purchases, quantify how often a buyer saw a Sponsored Brands ad before converting on an organic listing, and measure incremental reach across campaign types.
For sophisticated SOV analysis, AMC provides the most complete picture available on Amazon. Brands using AMC can determine whether their paid SOV investment is genuinely incremental or whether it is cannibalizing organic conversions they would have received anyway.
4. Sponsored Products Bid Landscape Changes
Amazon increased competition in the Sponsored Products auction through expanded advertiser access and lower barrier-to-entry for brand-new accounts in 2024. The average cost-per-click across Amazon’s top 10 product categories increased roughly 15 to 20% year over year in 2024, making paid SOV more expensive to maintain at the same impression share.
Brands that held paid SOV steady in 2024 without increasing budgets proportionally lost actual impression share in real terms, even if their spend stayed flat. This is a meaningful structural shift. Maintaining SOV now requires active budget management tied to auction dynamics, not just a static monthly spend number.
Tools That Measure Amazon Share of Voice
| Tool | SOV Type Measured | Data Source | Best For |
|---|---|---|---|
| Helium 10 Market Tracker 360 | Organic + Paid | Amazon SERP crawl | Full-category view |
| Pacvue | Paid only | Amazon Advertising API | Agency-level management |
| DataHawk | Organic + Paid blended | SERP crawl + Ad API | Mid-market brands |
| Perpetua | Paid primary | Amazon Advertising API | Automated bidding users |
| Amazon Brand Analytics | Click share proxy | Amazon first-party | Baseline SOV estimates |
| Amazon Marketing Cloud | Attribution + overlap | Amazon first-party | Advanced attribution |
Each tool has trade-offs between data freshness, keyword scale, and methodological accuracy. Using Amazon Brand Analytics alongside one third-party SERP-crawling tool covers most SOV use cases without requiring enterprise-level investment.
Frequently Asked Questions
What is a good Share of Voice on Amazon?
A good SOV depends on category competitiveness. In highly competitive categories like supplements or electronics, 15 to 20% paid SOV on primary keywords is strong. In smaller or emerging categories, a well-funded brand can realistically target 35 to 50% SOV. Focus on SOV relative to your direct competitors, not an absolute number in isolation.
Is Share of Voice the same as Impression Share in Amazon Ads?
They are related but not identical. Impression Share in Amazon Advertising refers specifically to paid ad impressions captured versus total eligible impressions on the keywords you are bidding on. Share of Voice is a broader concept that includes organic search result appearances and can span multiple channels including display and sponsored brand placements.
Can small sellers track Share of Voice without expensive tools?
Yes. Using Amazon Brand Analytics click share data combined with manual SERP tracking in incognito mode across 20 to 30 core keywords produces a usable SOV baseline. It takes time but the data is directionally accurate enough to make meaningful decisions.
How often should Share of Voice be tracked?
Weekly tracking is the minimum for active categories. In Q4 or during promotional events like Prime Day, daily or every-other-day tracking lets you respond to competitive shifts fast enough for the data to be actionable.
Does organic SOV or paid SOV matter more?
Organic SOV is more durable and cost-efficient at scale. Paid SOV is more immediate and controllable. During a new product launch or competitive attack, paid SOV is the faster lever. For mature products in a stable category, organic SOV delivers better long-term economics. Most brands need both.
How does Share of Voice relate to Amazon’s algorithm?
Sales velocity and click-through rate from high-SOV positioning feed directly into Amazon’s ranking algorithm. More paid SOV creates more conversion events, which Amazon’s algorithm uses to determine organic relevance. This is why paid and organic SOV are not separate strategies but a single compounding system.
What keywords should be included in Share of Voice tracking?
Include your top 5 to 10 revenue-driving keywords, the top category keywords by search volume, any keywords where you have seen competitors aggressively advertise, and your branded terms. Avoid including keywords that have never produced a conversion in your own campaigns, as they distort the metric without adding strategic value.