

Amazon’s advertising reports are vital tools for tracking and optimizing PPC campaigns. They provide the raw numbers: impressions, clicks, conversions, sales: that are scientifically interpreted Amazon ads management services to study sales numbers versus profit of every single keyword.
These reports are your “North Star” for understanding ad performance. Without them, you’re essentially flying blind and you can launch ads, but you won’t know what’s working or wasting spend.
By regularly downloading and analyzing Amazon Advertising Reports, sellers can make data-driven adjustments (e.g. pausing low-performing keywords or boosting high-converting campaigns) to improve profitability and organic ranks.
How to Download Advertising Reports
Amazon keeps all the reports in the Seller Central Advertising Console.
1. The Reporting Dashboard
You’ll find all the “Amazon ads reports” under the ‘Measurement & Reporting‘ icon, located in the left-hand menu of your ad console.
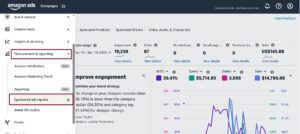
Once you click that icon, you’re in. This is the main reporting dashboard where you can generate new reports or download any you’ve created in the past.
2. Creating a New Report
To pull some data, follow this step-by-step process:
- In Measurement & Reporting dashboard and look for the Create report button. This will open a configuration screen.
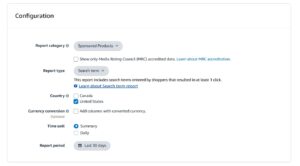
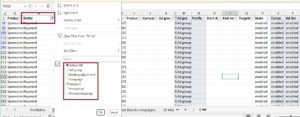
- Choose your report settings. You’ll need to specify the campaign type (like Sponsored Products), the report you want (such as Search term or Placement), and the time unit.
- Select a time unit, either ‘Summary’ or ‘Daily’. A summary report gives you aggregated data for your selected date range in one row. The daily report breaks down performance for each day.
- Set your reporting period. You can use a preset like ‘Last 30 days’ or input a custom date range.
- Click Run report.
Amazon will process your request. It’s usually quick, but it can take longer for large accounts or long date ranges. Once finished, a download link will appear on the main reporting page.
Amazon only retains on-screen data for about 60 days, so it’s critical to download reports regularly. As AdBadger warns, “Your data will disappear every 60 days”. Make it a habit to save monthly reports or else you’ll lose historic analytics.
Types of Amazon Advertising Reports
Amazon groups its advertising reports by ad type. Each report category reveals different facets of campaign performance.
1. Sponsored Products Reports
Sponsored Products Reports include Search Term, Targeting, Advertised Product, Campaign, Budget, Placement, Purchased Product, Performance Over Time, Search Term Impression Share, and Gross & Invalid Traffic reports.
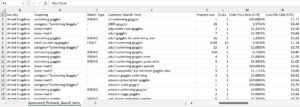
- The Search Term Report (SP & SB) lists every customer search term that triggered your ads and its performance metrics.
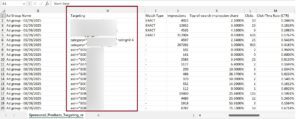
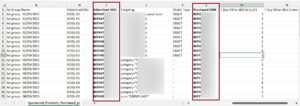
- The Targeting Report (SP) or Keyword Report (SB) shows all keywords or ASINs you bid on.
- Advertised Product Reports list all ASINs or SKUs being advertised and their metrics.
- Placement Reports break performance out by placement (e.g., top of search vs. product pages).
- Budget Reports (SP) show how campaign budgets were used.
- Performance Over Time tracks trends (currently only clicks, CPC, and spend).
- The Search Term Impression Share Report (SP) reveals your share of ad impressions for each query.
- Gross & Invalid Traffic Reports flag fraudulent or invalid clicks.
2. Sponsored Brands Reports
Sponsored Brands Reports include Keyword, Keyword Placement, Campaign, Campaign Placement, Search Term, Search Term Impression Share, Category Benchmark, Attributed Purchases, and Gross & Invalid Traffic reports.
- The Keyword Report (SB) is analogous to the SP targeting report.
- Search Term Reports (SB) show customer queries triggering brand ads.
- The Category Benchmark Report compares your brand’s ad performance (CTR, ACoS, etc.) against industry averages.
- Attributed Purchases tells you which off-page keywords or creatives drove purchases (if using brand stores).
- Impression Share Reports show share-of-voice on queries.
3. Sponsored Display Reports
Sponsored Display Reports include Campaign, Targeting, Advertised Product, Purchased Product, Matched Target, Pricing Transparency, and Gross & Invalid Traffic reports.
The Matched Target Report lists the audience segments matching your display ads.
Pricing Transparency shows how your product pricing compares to others (helpful for trust).
4. Amazon Attribution Reports
For off-Amazon ads (e.g. Facebook, Google), attribution reports give channel-level and campaign-level insights, such as Channel/Publisher, Campaign, Keyword/ Creative, Promoted Product, and Brand Halo reports . Attribution reports let you see how external campaigns drive Amazon sales, closing the loop on cross-channel marketing.
Using Reports to Optimize Campaigns
Advertising reports are most valuable when used to make specific changes. Here are common use cases and examples:
1. Search Term Report
Amazon Search Term Report is a goldmine. It shows the actual queries customers used to find your ads. For example, if you bid broad match on keyword “running shoes” and it find “men’s running shoes” in the search term report with good sales and conversion rate, add “men’s running shoes” as an exact-match keyword to rank and get organic sales.
Conversely, any search term with lots of impressions but very low CTR or zero conversions is a waste; add those as negative keywords to prevent further spend.
The search term report is the best example of why you should be utilizing reports as it unlocks exactly which customer searches drive performance.
2. Targeting Report
Use this to audit your bids. It lists every keyword or ASIN you’re targeting (including in auto campaigns), with metrics like spend, ACoS and even ROAS.
It’s great for finding duplicate keywords across campaigns (so you’re not competing against yourself).
Also, review ROAS in this report as it explicitly shows return per dollar spent. Keywords with very high ACoS or low ROAS may need bid cuts or negatives.
3. Advertised Product Report
This report lists all your advertised ASINs by campaign/ad group, showing how many impressions and clicks each gets.
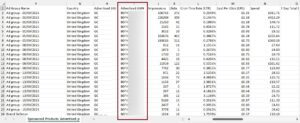
Use this to find your best-performing SKUs (for example, those with high impressions and sales). During peak seasons, you might allocate more budget to these star products.
It can also reveal if an ASIN is in an ad group but never receiving impressions (maybe it isn’t winning the buy box).
It also highlights the “duds”, ASINs that consume your ad budget with little to no sales. You can pause ads for these products and shift that money to your winners.
4. Placement Report
Placement report shows performance split by placement (e.g. “Top of Search (First Page)”, “Product Pages”).

If you see that “Top of Search” has a much better conversion rate or ROAS, consider increasing bids for that placement. This report (especially for SP campaigns) lets you optimize placement bids at scale.
This report makes the “Adjust bids by placement” setting effective. If you find your ads convert well at the top of search, you can apply a bid multiplier (e.g., +50%) to increase your chances of winning that spot. If product pages are not performing, you can reduce your bids there and focus your spend elsewhere.
5. Purchased Product Report
For Sponsored Product/Display, this report ties each sale back to the ASINs purchased. It only lists advertised keywords (not search terms) that led to purchases.
Use it to double-check which keywords truly generate sales. If you advertise multiple ASINs in one ad group, the report can’t break down which specific ASIN was purchased.
6. Search Term Impression Share
If you suspect you’re losing auctions, this report shows how often you appear on each search term compared to competitors. A low share (say 20%) means competitors are dominating that term. You might respond by raising your bids or budget for high-value keywords.
The report also gives an “impression rank” (e.g. rank 3 means you got the 3rd most impressions on that term), helping you gauge relative position.
7. Category Benchmarks (SB only)
With this report you can compare your CTR and ACoS to category averages. If your CTR is below benchmark, test new creatives or keywords.
8. Gross & Invalid Traffic
Always check this report to see if a portion of your clicks/impressions are flagged as invalid (bot or accidental). If you have unusually high invalid clicks, Amazon usually credits those back.
9. Matched Target Report (Sponsored Display)
If you use contextual targeting (placing ads on similar product detail pages), this report lists the exact ASINs where your ads appeared, giving you a list of new product targets for other campaigns.
Example Scenarios For PPC Optimization
Suppose your Sponsored Products Search Term report shows that the query “wireless earbuds blue” had 1,000 impressions with 15 clicks (1.5% CTR) and $0 sales. This indicates wasted spend.
You could add “wireless earbuds blue” as a negative keyword to prevent ads from showing on that term. Similarly, you might filter the report in Excel by “Sales = 0 and Spend > $0” to list all non-converting terms.
Another Scenario: Your Targeting report shows the keyword “stainless steel water bottle” is active in two different campaigns. You’d remove it from one to avoid self-competition. If that keyword’s ACoS is 100% or more, you might also pause it entirely.
Managing Campaigns with Bulk Operations
Amazon’s Bulk Operations tool lets you manage campaigns at scale using spreadsheets. Instead of editing ads one-by-one in the console, you can download a CSV sheet of your entire account’s campaigns/ad groups/keywords, make mass changes, and re-upload it.
For example, you could add new keywords or SKUs, pause or enable dozens of campaigns or ad groups, adjust bids/budgets by percentage, or add negative targets, all in one file. This is invaluable for large catalogs or running frequent updates.
1. How to Access and Download Bulk Files
Working with a bulk file is a three-step cycle: download, edit, and upload.
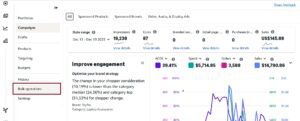
- Go to Bulk Operations: In your Advertising Console, go to the ‘Campaigns’ tab and find ‘Bulk operations’.
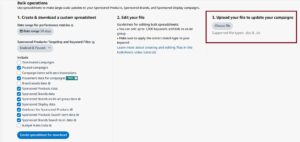
- Download Your Data: Create a new bulk file by selecting a date range. A short range, like ‘Last 30 days’, keeps the file size manageable. You can also filter by campaign type or status. Click ‘Create spreadsheet for download’.

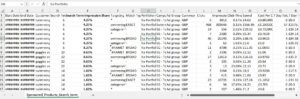
Editing and Uploading Bulk Sheets
You can open the downloaded file in Excel. You will see one or more tabs (e.g. Sponsored Products, Sponsored Brands, Sponsored Display).
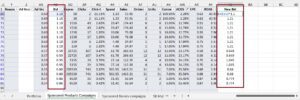
Each row represents an entity (Campaign, Ad Group, Keyword, etc.) and includes columns such as Campaign Name, Max Bid, Daily Budget, Placement, and performance data like Spend and Sales.
1. Making Your Edits
You can change values in the editable columns. Common edits include increasing/decreasing bids and budgets, pausing or renaming campaigns, and changing targeting settings.
For instance, modify the Max Bid column to raise or lower keyword bids, or adjust the Campaign Daily Budget column. You can also add new rows to create new campaigns/ad groups/keywords (using the Bulk Operations template).
Use formulas if desired. Because this is a spreadsheet, you can apply Excel formulas. You can insert custom formulas, for example, to decrease or increase all bids by a fixed percentage.
To optimize the bids in bulk file and apply filter on top row, go to the entity column and select “Keyword”. To optimize bids for the advertising ASINs, you will select “Product Targeting”.
You can add a temporary column “New Bid” to calculate a new bid. For example to increase each bid by 10% on keywords where ACOS is lower than the target ACOS, set a formula like “=CurrentBid * 1.1″ in a new column, then paste values back into “Bid” column.
After using formulas, ensure the final values are copied back into the standard columns.
Do not change the “Record ID” column (or similar ID columns) at all. Amazon uses these IDs to match each row to the correct campaign/ad internally.
Editing or deleting the wrong ID can break the upload. Only change editable fields like names, bids, budgets, and status.
When you have finished editing, save the file. Then return to the Bulk Operations page.
Upload the Modified Sheet
On the Bulk Operations page, click Choose file and select your edited bulksheet, then click Upload. Amazon will process the file (again, this may take a while for large files.
Review the results. After upload, the page will list each change’s status. Click Download Report under the Report column to get a detailed report of the upload.
This report shows which rows succeeded and flags any errors or warnings. Review it carefully: for example, it will alert you to formatting problems or invalid values. Fix any issues in the sheet and re-upload if needed.
3. Common Upload Errors and How to Fix Them
It is common to encounter an error when you first start. After uploading a file, Amazon provides a processing report that flags any issues.
Here are the most common problems:
- Invalid Bid: You may have entered a bid that’s too low or has a typo. The report will identify the row with the error for you to fix.
- Incorrect Status: You can only use specific terms like ‘enabled’, ‘paused’, or ‘archived’. A misspelling will cause the upload to fail for that row.
- Modified Record ID: Never change the ‘Record ID’ column. Amazon uses this identifier to match your changes to the correct campaign or keyword. Changing it will cause confusion in the system.
Working with bulk files can significantly improve your workflow. For even more efficiency, many sellers use third-party Amazon PPC tools that can automate many of these bulk changes.
Key Metrics in Your Reports
Your Amazon advertising reports contain a lot of data, which can seem overwhelming at first. These metrics are the language of your ad performance. Once you understand them, you can make smarter, more profitable decisions.
Let’s break down the core metrics found in most reports.
1. Traffic and Engagement Metrics
These are your top-of-funnel numbers, showing how many people see your ads and if they are compelling enough to click.
- Impressions: The number of times your ad was loaded on a page. An impression does not guarantee a shopper saw it, only that it was displayed.
- Clicks: The number of times someone clicked on your ad. A click is the first sign of a shopper’s interest.
- Click-Through Rate (CTR): Calculated as Clicks ÷ Impressions, CTR is the percentage of people who clicked your ad after seeing it. A low CTR can indicate issues with your main image, title, price, or review count.
- Cost-Per-Click (CPC): The average amount you pay each time someone clicks your ad. Monitoring your CPC is important for profitability.
2. Conversion and Sales Metrics
After getting the click, these metrics show if that click resulted in a sale, connecting your ad spend to revenue.
- Orders: The total number of unique orders placed after a shopper clicked your ad.
- Sales: The total dollar amount of revenue from orders attributed to your ads.
- Conversion Rate (CVR): The percentage of clicks that result in a sale (Orders ÷ Clicks). A good CVR means your product detail page is effective.
Based on 2025 industry data, Amazon’s average CVR for paid ads is typically in the high single digits to low teens. Average CPC benchmarks for Amazon Ads in 2025 are often around $0.99–$1.04, with many new sellers targeting an ACoS of about 29–30%.
3. Efficiency and Profitability Metrics
These metrics directly connect your ad spend to your sales, showing your campaign’s financial health.
Advertising Cost of Sales (ACoS) is a widely used metric, calculated by dividing your ad spend by your ad sales (Spend ÷ Ad Sales). It shows how much you spent on ads to generate one dollar in sales. A lower ACoS generally means higher profitability.
ACoS is only part of the story. A very low ACoS is not always the goal. When launching a new product, a higher ACoS might be acceptable to gain market share and build sales velocity.
Another important metric is Total Advertising Cost of Sales (TACoS). This measures your ad spend against your total sales (Ad Spend ÷ Total Sales), including both paid and organic revenue.
TACoS helps you see if your ads are creating a “halo effect” by boosting organic sales. If your TACoS is decreasing while total sales are increasing, it’s a good sign that your advertising is building long-term momentum.
Of all the numbers, Return on Ad Spend (ROAS) is one of the most critical. For a deeper understanding of how to calculate return on ad spend (ROAS), there are resources that explain the formula. If you’re deciding which metric to focus on, our comparison of ACoS vs. ROAS can be helpful.
How to Use The Amazon Reports Data
Pulling your Amazon advertising reports is just the first step. The real work is turning that raw data into actions that improve your campaigns.
An unread report is just a file on your computer. An analyzed report is a roadmap to better results. For small businesses, effective data analytics for small business is key to turning spreadsheets into winning strategies.
The following is a practical routine for connecting report findings to specific changes in your campaigns.

1. Wasted Spend with the Search Term Report
Your Search Term Report is the primary tool for reducing wasted spend. The goal is to find search terms that use your budget without generating sales and add them as negative keywords. This is the quickest way to improve your ACoS.
Here is a simple process:
- Filter your report: Open the Search Term Report and sort the data by Spend from highest to lowest.
- Identify zero-sale terms: Look for search terms with a significant number of clicks (e.g., 10-15 or more) but zero orders. These are wasting your money.
- Add as negative exact: In your Sponsored Products campaign, add these irrelevant terms as negative exact match keywords. This prevents your ads from showing for those specific, non-converting queries again.
Make this a weekly habit to constantly refine your targeting and ensure your budget is used effectively.
2. Harvest Winners for Manual Campaigns
While reviewing the Search Term Report, also look for profitable keywords. Your automatic and broad match campaigns act as keyword research tools, and this report shows which customer search terms are converting well.
Scan for search terms with multiple orders and a good ACoS. Add these winners as exact match keywords to a dedicated manual campaign to give them the budget and attention they deserve.
3. Optimize Bids with the Placement Report
Not all ad placements are equal. A click from the top of the search results is usually more valuable than one from a product page. The Placement Report provides data to prove this and helps you adjust your bids accordingly.
Analyze your campaign performance across these placements:
- Top of search (first page)
- Rest of search
- Product pages
If you see a much better conversion rate and ACoS at the top of search, you should increase your bid for that spot. In your campaign settings, use the “Adjust bids by placement” feature to add a percentage increase, like +25%, for top-of-search placements. This tells Amazon you’re willing to pay more for that valuable ad space.
4. Reallocate Budgets with the Advertised Product Report
Use the Advertised Product Report to make smarter decisions at the ASIN level. This report helps you identify which products are your advertising champions and which are draining your budget.
Sort the report by spend to see which ASINs are using the most ad dollars. If a product has high spend but a poor ACoS, consider pausing it in your campaigns. This frees up the budget, which you can then reallocate to your top-performing ASINs. This simple change ensures your ad spend is always working as hard as possible for you.
Frequently Asked Questions
How Often Should I Analyze My Ad Reports?
Once your campaigns are running, reviewing your search term and placement reports weekly is a good practice. This allows you to quickly cut wasted spend on irrelevant keywords and adjust bids before you overspend.
For a broader perspective, a more in-depth analysis of all your Amazon advertising reports is best done every few weeks or monthly. This helps you assess your overall strategy, connect different data points, and identify long-term trends.
What Is a Good ACoS?
There is no single “good” ACoS. It depends on your product’s profit margin and your current goals. The most important figure to know is your break-even ACoS, which is your profit margin before ad costs.
If you’re launching a new product, a higher ACoS may be acceptable to gain attention and build sales momentum. For a mature product, you’ll want your ACoS to be comfortably below your profit margin to ensure each ad-driven sale is profitable.
Why Do My Ad Report Sales Not Match My Business Reports?
This is a common question among sellers. The difference is due to how sales are attributed. Your advertising reports use an attribution model, which looks back over a set period, usually 7 or 14 days.
If a shopper clicks your ad and then buys your product within that window, the ad gets credit for the sale. Your business reports, however, track sales in real-time. This difference in timing is why the numbers rarely match perfectly.