Amazon sellers obsess over traffic, conversions, and ad spend. But one metric quietly determines whether your business scales profitably or stalls: Amazon Average Order Value (AOV). A higher AOV means more revenue from every transaction without spending a single extra dollar on customer acquisition.
This guide breaks down exactly how to increase your Amazon average order value using proven strategies, real benchmarks, and actionable tactics that top sellers use in 2026. Whether you sell in Beauty, Home & Kitchen, or Electronics, these methods apply across categories.
What Is Amazon Average Order Value (AOV)?
Amazon Average Order Value (AOV) measures the average dollar amount a customer spends per transaction on your products. It is one of the most important profitability metrics for Amazon sellers because it directly impacts revenue, profit margins, and advertising efficiency.
Unlike conversion rate or session count, AOV reflects the quality of each sale. Sellers with a high AOV generate more revenue per customer interaction, which reduces the relative cost of advertising and fulfillment.
AOV Formula for Amazon Sellers
Calculating your Amazon AOV is straightforward. You divide total revenue by the total number of orders within a specific time period.
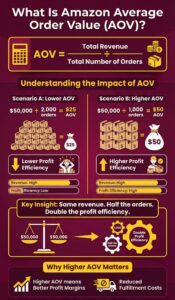
AOV = Total Revenue / Total Number of Orders
Here is a quick example to illustrate how AOV works in practice.
- Scenario A: $50,000 revenue from 2,000 orders = $25 AOV
- Scenario B: $50,000 revenue from 1,000 orders = $50 AOV
Both scenarios produce the same revenue. But Scenario B achieves it with half the orders, meaning lower fulfillment costs, fewer customer service interactions, and better profit margins per transaction.
1. Amazon Average Order Value Benchmarks (2024-2025)
Understanding where your AOV stands relative to industry benchmarks helps you set realistic improvement targets. Amazon’s platform-wide AOV tends to be lower than general ecommerce because of the marketplace’s emphasis on competitive pricing and convenience.
Amazon’s platform-wide average order value falls between $47 and $55. By comparison, the broader US ecommerce AOV sits closer to $120 to $140, according to the Adobe Digital Economy Index.
2. AOV: Amazon vs. General Ecommerce
The gap between Amazon’s AOV and general ecommerce AOV exists largely because Amazon encourages single-item purchases through its one-click buying system. The table below highlights this difference across key benchmarks.
| Metric | Amazon Platform | US Ecommerce Average |
| Average Order Value | $47 to $55 | $120 to $140 |
| Prime Member Annual Spend | ~$1,400/year | N/A |
| Non-Prime Annual Spend | ~$600/year | N/A |
| Revenue from Product Recommendations | 35% | 10 to 15% |
3. AOV by Amazon Product Category
AOV varies significantly by product category. Sellers in Electronics and Home & Kitchen typically enjoy higher order values than those in Beauty or Grocery.
The table below provides estimated AOV ranges across major Amazon categories.
| Amazon Category | Estimated AOV Range | Typical Price Point |
| Electronics & Accessories | $75 to $150+ | High |
| Home & Kitchen | $40 to $80 | Medium to High |
| Sports & Outdoors | $35 to $70 | Medium |
| Health & Personal Care | $25 to $45 | Low to Medium |
| Beauty & Skincare | $20 to $40 | Low to Medium |
| Grocery & Gourmet | $18 to $35 | Low |
| Pet Supplies | $25 to $50 | Medium |
| Baby Products | $30 to $55 | Medium |
| Clothing & Apparel | $28 to $50 | Low to Medium |
| Tools & Home Improvement | $40 to $85 | Medium to High |
Note: Ranges are industry estimates based on average selling prices and third-party marketplace reports. Actual AOV depends on product mix, pricing strategy, and bundling.
If your current AOV falls below your category average, that signals a clear opportunity to improve.
4. Prime vs. Non-Prime Spending Behavior
Amazon Prime members are significantly more valuable customers. Data from CIRP shows that Prime members spend approximately 2.3 times more annually than non-Prime shoppers. This spending gap makes Prime-eligible listings and Subscribe & Save enrollment critical for AOV growth.
Key spending differences between Prime and non-Prime shoppers include the following.
- Annual spend per Prime member: approximately $1,400
- Annual spend per non-Prime member: approximately $600
- Prime members globally: 200+ million
- Order frequency: Prime members order 25 to 30 times per year vs. 12 to 15 for non-Prime
- Free shipping expectation: Prime members expect fast, free delivery, reducing price sensitivity
Why Increasing Amazon AOV Beats Chasing More Traffic
Most Amazon sellers default to driving more traffic when they want to grow revenue. They increase ad budgets, launch new campaigns, and chase higher search rankings. But increasing AOV is almost always more cost-effective because it requires zero additional customer acquisition cost.
Consider this: if you spend $2.00 per click on Amazon PPC and your conversion rate is 10%, each order costs you $20 in advertising. Increasing your AOV from $35 to $50 adds $15 in revenue to every single order without touching your ad spend.
1. AOV Impact on Profitability
The table below compares two growth approaches for an Amazon seller generating $50,000/month. One approach increases traffic by 30%. The other increases AOV by 30%. Both produce similar revenue gains, but the profitability difference is significant.
| Growth Lever | Current State | +30% Traffic | +30% AOV |
| Monthly Sessions | 25,000 | 32,500 | 25,000 |
| Conversion Rate | 10% | 10% | 10% |
| Orders | 2,500 | 3,250 | 2,500 |
| AOV | $20 | $20 | $26 |
| Monthly Revenue | $50,000 | $65,000 | $65,000 |
| Ad Spend Increase | $0 | +$3,750 | $0 |
| FBA Fulfillment Cost Increase | $0 | +$2,437 | Minimal |
| Net Revenue Gain | Baseline | +$8,813 | +$15,000 |
The AOV approach delivers nearly double the net revenue gain because there are no additional advertising or fulfillment costs per unit. This is why experienced Amazon sellers prioritize AOV optimization before scaling ad budgets.
How to Calculate Your Amazon Average Order Value
You can pull the data needed for AOV calculations directly from Amazon Seller Central. The Business Reports section contains the metrics you need, specifically the “Detail Page Sales and Traffic” and “Sales and Orders” reports.
Step-by-Step AOV Calculation
Follow these steps to calculate your current Amazon AOV for any time period.
- Log into Amazon Seller Central
- Navigate to Reports > Business Reports
- Select Sales and Orders by date range
- Note your Ordered Product Sales (total revenue)
- Note your Total Order Items (total orders)
- Divide total revenue by total orders
Here is a practical example of this calculation applied to a real scenario.
- Monthly revenue (Ordered Product Sales): $38,500
- Total orders: 1,100
- AOV: $38,500 / 1,100 = $35.00
If your goal is to reach a $45 AOV, you need each order to increase by $10. The strategies below show you exactly how to make that happen.
13 Proven Strategies to Increase Amazon Average Order Value
Each strategy below has been selected based on its direct impact on order value. They range from quick wins (like multi-packs) to long-term plays (like brand content). Use them individually or stack multiple strategies for compounding results.
1. Create Strategic Product Bundles
Product bundling is the single most effective way to increase Amazon average order value. When you package complementary items together, customers spend more per order because they perceive greater value in the combined offer compared to purchasing items separately.
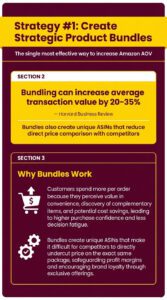
According to research published by Harvard Business Review, bundling can increase average transaction value by 20% to 35%. On Amazon specifically, bundles also reduce direct price comparison because your bundle ASIN is unique.
Successful Amazon bundles share these characteristics.
- Complementary products: Items naturally used together (e.g., yoga mat + carrying strap + cleaning spray)
- Genuine value: Bundle price should be 10% to 15% lower than buying items individually
- Unique ASIN: Each bundle gets its own listing, reducing direct competition
- Clear main image: Show all bundle components in the primary product photo
- Keyword-rich title: Include “bundle” or “kit” plus all component names
Bundling Example Calculation:
| Item | Individual Price | Bundle Contribution |
| Resistance Band Set | $18.99 | Included |
| Exercise Guide Booklet | $9.99 | Included |
| Carrying Pouch | $7.99 | Included |
| Individual Total | $36.97 | |
| Bundle Price | $29.99 | 19% discount |
| AOV Lift per Order | +$11.00 | vs. buying only the band set |
Bundles work best when the anchor product (your main seller) is combined with lower-cost accessories that have high margins.
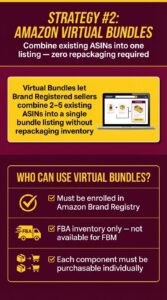
2. Use Amazon Virtual Bundles
Amazon Virtual Bundles let Brand Registered sellers combine two to five existing ASINs into a single bundle listing without repackaging inventory. This is a powerful tool because it requires zero additional inventory or FBA prep.
Virtual bundles appear as separate listings in search results and on product detail pages. Customers see the combined offer with a single “Add to Cart” button, which simplifies the purchase decision and increases cart value.
Important details about virtual bundles include the following.
- Available only to sellers enrolled in Amazon Brand Registry
- Limited to FBA inventory (not FBM)
- You can combine 2 to 5 ASINs per virtual bundle
- Each component must be purchasable individually
- Virtual bundles get their own unique detail page and can be advertised via Sponsored Products
- You set a single price for the bundle (typically 5% to 15% below the sum of individual prices)
Virtual bundles are ideal for testing bundle concepts before committing to physical packaging.
3. Offer Multi-Packs and Quantity Discounts
Multi-packs increase AOV by encouraging customers to buy a larger quantity of the same product in one order. This strategy works especially well for consumable products in categories like Health & Personal Care, Beauty, Grocery, and Pet Supplies.
Customers choose multi-packs when the per-unit savings are clearly communicated. Your listing title and bullet points should highlight the cost-per-unit advantage.
The table below shows how multi-pack sizing affects AOV for a hypothetical skincare product.
| Pack Size | Price | Price Per Unit | AOV Impact |
| Single (1 unit) | $14.99 | $14.99 | Baseline |
| 2-Pack | $26.99 | $13.50 | +80% AOV |
| 3-Pack | $37.99 | $12.66 | +153% AOV |
| 5-Pack | $59.99 | $12.00 | +300% AOV |
For maximum impact, consider these multi-pack best practices.
- List multi-packs as separate ASINs or as child variations under a parent listing
- Show per-unit savings prominently in bullet points and A+ Content
- Price multi-packs at a 10% to 20% per-unit discount compared to singles
- Use “Subscribe & Save” alongside multi-packs for additional retention
4. Optimize Parent-Child Variation Listings
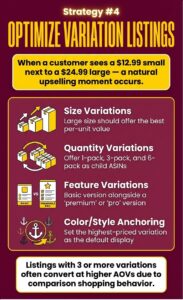
Parent-child variation listings display multiple product options (size, color, count, flavor) on a single detail page. When a customer lands on a $12.99 small-size listing and sees a $24.99 large-size option right next to it, a natural upselling moment occurs.
Structuring your variations strategically can nudge customers toward higher-priced options. The key is making the larger or premium variation clearly the better value.
Variation strategies that increase AOV include the following.
- Size variations: Offer small, medium, and large sizes where the large size has the best per-unit value
- Quantity variations: List 1-pack, 3-pack, and 6-pack as child ASINs
- Feature variations: Offer a basic version alongside a “premium” or “pro” version
- Color/style anchoring: Place the highest-priced variation as the default display
When customers compare variations side by side, they frequently upgrade. Amazon reports show that listings with 3 or more variations often convert at higher AOVs than single-option listings because of the comparison shopping behavior they enable.
5. Use A+ Content to Justify Premium Pricing
Amazon A+ Content (formerly Enhanced Brand Content) replaces the standard product description with rich media layouts that include images, comparison charts, and brand storytelling. Listings with A+ Content can command higher prices because they build trust and communicate product value more effectively.
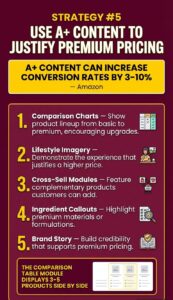
Amazon’s own data suggests that A+ Content can increase conversion rates by 3% to 10%. But its AOV impact comes from allowing you to justify premium pricing and promote your higher-priced products through on-page comparison modules.
AOV-boosting A+ Content tactics include the following.
- Comparison charts: Show your product lineup from basic to premium, encouraging upgrades
- Lifestyle imagery: Demonstrate the full product experience that justifies a higher price
- Cross-sell modules: Feature complementary products that customers can add to their order
- Ingredient/material callouts: Highlight premium materials or formulations
- Brand story section: Build credibility that supports premium pricing
The A+ Content comparison table module is particularly powerful for AOV. It lets you display 3 to 5 products side by side with check marks showing feature differences, naturally guiding shoppers toward your mid-tier or premium option.
6. Apply Price Anchoring and Tiered Pricing
Price anchoring uses a higher-priced option to make your target product look more affordable by comparison. On Amazon, this plays out through your variation structure, competitor positioning, and how you frame product tiers.
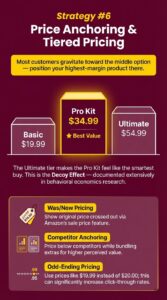
Tiered pricing works by creating a clear “good, better, best” structure within your product line. Most customers gravitate toward the middle option, which is why your highest-margin product should be positioned there.
Effective anchoring strategies include the following.
- Three-tier pricing: Offer a basic ($19.99), standard ($34.99), and premium ($54.99) version
- Was/Now pricing: Use Amazon’s sale price feature to show the original price crossed out
- Competitor anchoring: If competitors charge $49.99, pricing at $44.99 while bundling extras creates perceived value
- Volume anchoring: Show per-unit cost decreasing with larger quantities
Example of the “Decoy Effect” in Pricing:
| Option | Price | What’s Included | Purpose |
| Basic Kit | $19.99 | Core product only | Entry point |
| Pro Kit | $34.99 | Core product + 3 accessories | Target (best margin) |
| Ultimate Kit | $54.99 | Core product + 5 accessories + case | Anchor |
Most buyers will choose the Pro Kit because it feels like the best value compared to the Ultimate Kit’s price jump. This “decoy effect” has been documented extensively in behavioral economics research.
7. Enroll in Amazon Subscribe & Save
Subscribe & Save does not directly increase single-order AOV. However, it dramatically increases customer lifetime value (LTV) by locking in repeat purchases at predictable intervals. Over time, the cumulative order value per customer rises substantially.
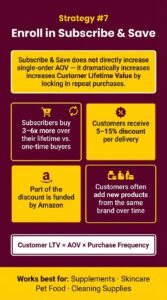
Subscribers also tend to add more items to their subscription deliveries, which increases per-delivery order value. Amazon gives customers a 5% to 15% discount for subscribing, which is offset by the increased purchase frequency and customer retention.
Key Subscribe & Save benefits for AOV and LTV include the following.
- Reduced churn: Customers receive products automatically, reducing competitor switching
- Higher LTV: Subscribers purchase 3 to 6 times more over their lifetime compared to one-time buyers
- Cross-subscription: Customers often add new products from the same brand to existing subscriptions
- Improved forecasting: Predictable revenue makes inventory planning easier
- 5% to 15% discount: Funded partly by Amazon when you meet enrollment criteria
Subscribe & Save works best for consumable products with regular replenishment cycles: supplements, cleaning supplies, pet food, skincare, and similar items.
8. Deploy Strategic Coupons and Promotions
Amazon coupons and promotions can increase AOV when structured to reward larger purchases. Instead of offering a flat percentage discount, use tiered promotions that incentivize spending more per order.
The green coupon badge also increases click-through rate from search results, driving more traffic to your listing. When combined with a spend-based promotion, this extra traffic converts at higher order values.
AOV-focused promotion types include the following.
- Buy 2, Save 10%: Encourages multi-unit purchases
- Spend $50, Save $10: Sets a spending floor that increases AOV
- BOGO 50% off: Doubles units per order while maintaining margin
- Coupon + Lightning Deal combo: Drives urgency with volume incentives
- Percentage-off coupons on bundles: Makes bundles more attractive than singles
A common mistake is offering flat discounts on single units, which reduces AOV. Always structure promotions to reward higher cart values.
9. Build a High-Converting Amazon Storefront
Your Amazon Storefront (Brand Store) acts as a mini-website within Amazon. It lets you showcase your entire product catalog, organize products by collection or use case, and guide customers toward higher-value purchases.
Storefronts increase AOV by exposing customers to your full product range. A shopper who lands on a single product listing sees only that item. A Storefront visitor browses multiple products, increasing the chance of adding complementary items to their cart.
Storefront optimization tactics for AOV growth include the following.
- Category pages: Organize products into logical groups (e.g., “Starter Kits,” “Best Sellers,” “Complete Sets”)
- Bundle showcase: Dedicate a page to your bundled offerings
- Hero banners: Feature your highest-AOV products prominently
- Shoppable images: Use lifestyle photos with clickable product tags
- Cross-sell navigation: Link between related product categories
Sellers with optimized Storefronts report higher attributed sales from Sponsored Brand campaigns, which direct traffic to Storefront pages rather than individual listings.
10. Target Higher-AOV Keywords with Amazon PPC
Not all keywords deliver the same AOV. Generic, broad keywords often attract price-sensitive shoppers, while specific, intent-rich keywords attract buyers willing to spend more. Adjusting your PPC strategy to target higher-AOV keywords can meaningfully increase average order value.
For example, a seller of kitchen knife sets might find that the keyword “chef knife” generates a $22 AOV, while “professional knife set with block” generates a $65 AOV. Shifting ad spend toward the higher-intent keyword improves both AOV and ROAS.
Steps to identify and target higher-AOV keywords include the following.
- Review Search Query Performance Report in Brand Analytics to see which queries drive the highest revenue per order
- Segment your campaigns by product tier (basic vs. premium) and allocate more budget to premium campaigns
- Use Sponsored Brands to drive traffic to Storefront pages featuring bundles and premium products
- Bid higher on bundle/multi-pack keywords like “[product] bundle,” “[product] set,” or “[product] 3-pack”
- Negate low-AOV keywords that consistently drive single-unit, low-value purchases
Tracking AOV by keyword through Amazon’s advertising reports helps you identify which campaigns contribute most to revenue growth.
11. Optimize for “Frequently Bought Together” Recommendations
Amazon’s “Frequently Bought Together” section appears on product detail pages and suggests complementary items that shoppers can add to their cart with a single click. This feature drives an estimated 35% of Amazon’s total revenue, according to McKinsey, making it one of the most powerful AOV levers on the platform.
You cannot directly control which products appear in this section. But you can influence it through purchasing patterns, advertising, and listing optimization.
Tactics to improve your Frequently Bought Together placement include the following.
- Cross-promote within your catalog: Run Sponsored Display ads targeting your own ASINs to create cross-purchase data
- Bundle complementary listings: When customers buy your products together, Amazon’s algorithm learns the association
- Coordinate launches: Release complementary products around the same time to build co-purchase history
- Optimize backend keywords: Include complementary product keywords in your listing’s search terms
- Encourage multi-item orders: Use A+ Content comparison charts to suggest add-ons
The more frequently customers buy two of your products together, the more likely Amazon’s algorithm will pair them in this recommendation widget.
12. Use Amazon Brand Content
Amazon Brand Story modules, and product videos serve as additional touchpoints that keep shoppers engaged with your brand and product line. Each touchpoint is an opportunity to showcase higher-value products or promote bundles.
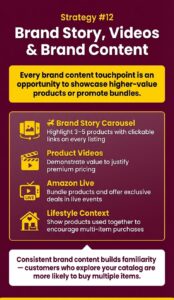
Brand Story modules appear within A+ Content and let you feature related products with clickable links.
Brand content strategies that boost AOV include the following.
- Brand Story carousel: Highlight 3 to 5 products in the scrollable brand story section on each listing
- Product videos: Demonstrate product value to justify premium pricing
- Amazon Live: Host live shopping events that bundle products and offer exclusive deals
- Lifestyle context: Show products being used together to encourage multi-item purchases
Consistent brand content builds familiarity, which increases the likelihood that customers explore your catalog and buy multiple items.
13. Implement Post-Purchase Upsell Strategies
The customer relationship does not end at checkout. Post-purchase strategies help you increase the total value of each customer over time, which raises your effective AOV across all orders.
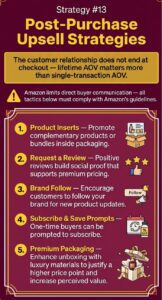
While Amazon limits direct communication with buyers, there are still effective post-purchase tactics you can use to drive repeat and higher-value purchases.
Post-purchase AOV strategies include the following.
- Product inserts: Include a card in your packaging that promotes complementary products or bundles (must comply with Amazon’s communication guidelines)
- Amazon’s “Request a Review” button: Positive reviews build social proof that supports premium pricing
- Brand follow: Encourage customers to follow your Amazon brand for new product updates
- Subscribe & Save prompts: Customers who buy once can be prompted to subscribe for future deliveries
- Warranty registration: Direct customers to register products, building a list for future launches
- Packaging quality: Premium packaging supports premium pricing and reduces return rates
Focus on creating repeat customers who buy across your product line, as lifetime AOV matters more than single-transaction AOV.
Quick Reference: AOV Strategy Comparison
Not every strategy delivers the same ROI or requires the same effort. The table below ranks each AOV strategy by estimated impact, implementation difficulty, and time to results.
| Strategy | AOV Impact | Effort Level | Time to Results |
| Product Bundles | High (20-35%) | Medium | 2 to 4 weeks |
| Virtual Bundles | Medium (10-20%) | Low | 1 to 2 weeks |
| Multi-Packs | High (15-30%) | Medium | 2 to 4 weeks |
| Variation Optimization | Medium (10-20%) | Low | 1 to 2 weeks |
| A+ Content | Medium (5-15%) | Medium | 2 to 3 weeks |
| Price Anchoring | Medium (10-20%) | Low | Immediate |
| Subscribe & Save | Low (direct) / High (LTV) | Low | 4 to 8 weeks |
| Strategic Promotions | Medium (10-25%) | Low | Immediate |
| Storefront Optimization | Medium (10-15%) | Medium | 2 to 4 weeks |
| Higher-AOV PPC Keywords | Medium (10-20%) | Medium | 2 to 4 weeks |
| Frequently Bought Together | High (15-30%) | High | 4 to 12 weeks |
| Brand Content | Low to Medium (5-15%) | Medium | 4 to 8 weeks |
| Post-Purchase Upsells | Low to Medium (5-10%) | Low | 4 to 8 weeks |
Start with the strategies that offer high impact and low effort: virtual bundles, variation optimization, and price anchoring.
Frequently Asked Questions
What is a good average order value on Amazon?
A good Amazon AOV depends on your product category. Platform-wide, Amazon’s AOV ranges from $47 to $55. Electronics sellers often see AOVs above $75, while Beauty and Grocery sellers may average $20 to $40. Your AOV should meet or exceed your category average for healthy performance.
How do you calculate average order value on Amazon?
Divide your total revenue (Ordered Product Sales) by your total number of orders within a specific time period. You can pull both figures from Seller Central under Reports > Business Reports > Sales and Orders. The formula is AOV = Total Revenue / Total Orders.
Does product bundling really increase Amazon AOV?
Yes. Product bundling is one of the most effective AOV strategies. Research from Harvard Business Review shows bundling can increase average transaction value by 20% to 35%. On Amazon, bundles also create unique ASINs that reduce direct price comparison with competitors.
Can Amazon PPC campaigns help increase AOV?
Absolutely. By targeting higher-intent, product-specific keywords and directing traffic to bundle listings or premium products, you can increase the average revenue generated per click. Sponsored Brands campaigns that point to your Storefront are particularly effective because they expose shoppers to your full product lineup.
What is the difference between AOV and customer lifetime value?
AOV measures revenue per single transaction. Customer lifetime value (LTV) measures total revenue from a customer across all their purchases over time. LTV equals AOV multiplied by purchase frequency. Both metrics are important, but LTV gives a more complete picture of customer profitability.
How does Subscribe & Save affect Amazon AOV?
Subscribe & Save has a minimal direct impact on single-order AOV because it offers a 5% to 15% discount. However, it significantly increases customer lifetime value by generating recurring purchases. Subscribers also tend to add more items to their deliveries over time, which gradually raises per-delivery order value.
How often should I monitor my Amazon AOV?
Review your AOV at least monthly. During peak seasons (Prime Day, Q4 holidays), check weekly. Compare AOV trends alongside conversion rate and profit margin to ensure increases in order value are not coming at the expense of other key metrics.
What Amazon tools show average order value data?
Seller Central Business Reports provide the raw data (revenue and order count) needed to calculate AOV. Brand Analytics offers deeper insights into search query performance and customer demographics. Third-party tools like Helium 10, Sellerboard, and JungleScout offer automated AOV tracking and trend analysis.
Do multi-packs cannibalize single-unit sales on Amazon?
Some cannibalization is expected, but multi-packs typically generate higher total revenue and better margins. The per-unit discount you offer on multi-packs is usually smaller than the AOV increase they produce. List both singles and multi-packs as child variations so customers can choose their preferred option.
How does A+ Content help increase Amazon average order value?
A+ Content builds perceived value through rich imagery, comparison charts, and brand storytelling. The comparison chart module is especially powerful because it displays your product lineup side by side, naturally guiding shoppers toward mid-tier or premium options. Amazon reports that A+ Content can increase conversions by 3% to 10%, and the pricing confidence it creates supports higher AOV.