
Amazon CTR (Click-Through Rate) measures the percentage of shoppers who click on your product listing after seeing it in search results or on an ad placement. It is calculated as the number of clicks divided by the number of impressions, then multiplied by 100.
CTR is essentially a relevance and appeal score. When your listing appears in front of a shopper and they choose to click on it, Amazon interprets that as a positive signal. A consistently high CTR tells the algorithm your product matches what customers are looking for.
Here are the key reasons CTR matters for Amazon sellers in 2026.
- Higher CTR means more clicks at the same spend, which lowers your effective CPC
- Amazon’s A10 algorithm factors in click behavior when determining search rankings
- Amazon rewards relevant, high-CTR ads with premium placements at lower costs
- More qualified clicks translate into more conversions and higher sales velocity
- When CTR improves alongside stable conversion rates, your ACoS naturally decreases
Below is a summary of average Amazon CTR benchmarks aggregated from industry reports covering 2024 and 2025 data.
| Metric | Average CTR | Good CTR | Top Performer CTR |
|---|---|---|---|
| Sponsored Products | 0.40% | 0.50% – 0.70% | 0.80%+ |
| Sponsored Brands | 0.25% | 0.35% – 0.50% | 0.60%+ |
| Sponsored Brands Video | 0.60% | 0.80% – 1.20% | 1.50%+ |
| Sponsored Display | 0.16% | 0.25% – 0.35% | 0.45%+ |
| Organic Listing (Page 1) | 1.50% – 3.00% | 3.00% – 5.00% | 5.00%+ |
These numbers serve as directional benchmarks. Your actual targets should be calibrated based on your specific category and competition level.
How to Calculate Amazon CTR
The Amazon CTR formula is straightforward. You divide total clicks by total impressions and multiply by 100 to get a percentage.
CTR (%) = (Clicks / Impressions) x 100
Below is a table showing three real-world calculation examples that illustrate how CTR works at different performance levels.
| Scenario | Impressions | Clicks | CTR |
|---|---|---|---|
| Low-performing ad | 25,000 | 50 | 0.20% |
| Average-performing ad | 25,000 | 100 | 0.40% |
| High-performing ad | 25,000 | 200 | 0.80% |
The difference between 0.20% and 0.80% CTR on the same 25,000 impressions is 150 additional clicks. At a 12% conversion rate, that is 18 extra orders without spending a single additional dollar on impressions.
Where to Find Your Amazon CTR Data
Amazon provides CTR data across several dashboards depending on whether you are tracking paid or organic performance. Knowing exactly where to look saves time and ensures you are measuring accurately.
Here are the main sources for tracking Amazon CTR in 2026.
- Amazon Advertising Console. Go to Campaign Manager, then select Reports. CTR is displayed at the campaign, ad group, and keyword level for all Sponsored ad types
- Search Term Report. Download this report from the Advertising Console to see CTR for individual search terms that triggered your ads
- Search Query Performance Dashboard. Available in Brand Analytics for brand-registered sellers. Shows impressions, clicks, and click share for organic search queries
- Business Reports. Under Seller Central, the Detail Page Sales and Traffic report shows sessions and page views, which can be used as a proxy for organic CTR
- Amazon Marketing Stream. For advanced sellers and agencies, this provides hourly CTR data through API integration
The Search Query Performance Dashboard is particularly valuable because it shows your organic click share versus competitors for specific search terms. This helps you identify where you are losing clicks even when you are ranking well.
Amazon CTR Benchmarks by Product Category
CTR varies significantly across product categories. Niche categories with fewer competitors tend to have higher CTRs, while saturated categories like electronics often see lower rates due to intense competition and price comparison behavior.
Below is a breakdown of average Sponsored Products CTR by major Amazon category based on 2024-2025 aggregated industry data.
| Product Category | Average SP CTR | Typical Range |
|---|---|---|
| Pet Supplies | 0.52% | 0.40% – 0.65% |
| Beauty and Personal Care | 0.48% | 0.38% – 0.58% |
| Health and Household | 0.46% | 0.35% – 0.55% |
| Sports and Outdoors | 0.45% | 0.35% – 0.55% |
| Baby Products | 0.44% | 0.35% – 0.55% |
| Toys and Games | 0.42% | 0.30% – 0.52% |
| Home and Kitchen | 0.40% | 0.30% – 0.50% |
| Office Products | 0.38% | 0.28% – 0.48% |
| Grocery and Gourmet | 0.36% | 0.25% – 0.45% |
| Clothing and Apparel | 0.35% | 0.25% – 0.45% |
| Tools and Home Improvement | 0.35% | 0.25% – 0.45% |
| Automotive | 0.34% | 0.25% – 0.45% |
| Electronics | 0.30% | 0.20% – 0.40% |
| Computers and Accessories | 0.28% | 0.18% – 0.38% |
Categories like Pet Supplies and Beauty consistently outperform because purchase decisions are often repeat-driven and less comparison-heavy. Electronics and Computers see lower CTRs because shoppers tend to browse multiple listings before clicking.
Amazon CTR by Ad Placement
Ad placement is one of the biggest factors influencing CTR. The same ad creative and keyword targeting can produce vastly different CTRs depending on where Amazon shows your ad. Understanding placement-level performance helps you allocate budget more effectively.
Below is a comparison of average CTR by Sponsored Products placement based on data reported by Perpetua and Ad Badger in 2025.
| Placement | Average CTR | Notes |
|---|---|---|
| Top of Search (First Page) | 0.80% – 1.50% | Highest visibility, strongest purchase intent |
| Rest of Search | 0.25% – 0.45% | Mid-page and bottom placements |
| Product Detail Pages | 0.10% – 0.30% | Shown on competitor listings, lower intent |
Top of Search placements consistently deliver 2x to 4x higher CTR than other placements. This is why Amazon’s “Adjust Bids by Placement” feature is so important. Many successful sellers bid 50% to 200% higher for Top of Search because the improved CTR and conversion rates justify the higher cost.
Key takeaways for placement optimization include the following.
- Top of Search deserves aggressive bidding if your conversion rate supports it
- Rest of Search provides volume at lower cost but often needs stronger creative to compete
- Product Pages work best for conquest campaigns where your product has a clear advantage over the host listing
- Monitor placement reports weekly to identify where your budget is being spent versus where your best performance occurs
What Is a Good CTR on Amazon?
There is no universal “good” CTR because it depends on your category, ad type, and competitive landscape. However, you can use benchmarks as a starting point and then set goals based on your own historical data and category norms.
Below is a quick reference that shows how to interpret your CTR performance across different ad types.
| CTR Level | Sponsored Products | Sponsored Brands | Sponsored Display |
|---|---|---|---|
| Poor | Below 0.25% | Below 0.15% | Below 0.08% |
| Below Average | 0.25% – 0.35% | 0.15% – 0.20% | 0.08% – 0.12% |
| Average | 0.35% – 0.50% | 0.20% – 0.30% | 0.12% – 0.20% |
| Good | 0.50% – 0.70% | 0.30% – 0.50% | 0.20% – 0.35% |
| Excellent | 0.70%+ | 0.50%+ | 0.35%+ |
If your CTR consistently falls in the “Poor” or “Below Average” range, it usually points to one of three problems: Weak main images, irrelevant keyword targeting or uncompetitive pricing. All three are fixable.
A useful rule of thumb is to aim for at least 1.5x the category average. So if your category average is 0.40%, target 0.60% or higher as your optimization goal.
How to Improve Amazon CTR: 12 Proven Strategies
Improving your Amazon CTR requires a systematic approach across creative, targeting, and pricing levers. Below are the most effective strategies ranked by their typical impact.
1. Optimize Your Main Image
Your main image is the highest-impact CTR lever. Follow Amazon’s image requirements, but also focus on making your product visually stand out in the search grid.
Specific actions to take include the following.
- Use the full frame of the image (product should fill 85% or more of the space)
- Ensure lighting is professional and colors are accurate
- Show the product at its most flattering angle
- Include all components if it is a bundle or kit
- Test different angles and compositions using Amazon’s Manage Your Experiments tool
2. Rewrite Your Product Title
Your title should be optimized for both the algorithm and human readability. Front-load the most important keywords and benefits in the first 80 characters.
A formula that works well for most categories follows this pattern.
Brand + Primary Keyword + Key Feature + Size/Quantity + Secondary Benefit
Example: “AquaPure Water Filter Pitcher, 10-Cup BPA-Free, NSF Certified, Removes 99% of Lead, Fits Standard Fridges”
3. Price Competitively
Run a pricing analysis against the top 10 listings for your primary keywords. You do not need to be the cheapest, but you need to be within the expected price range for your category and quality level.
Quick wins for pricing-related CTR improvements include the following.
- Attach a clippable coupon (5% to 20% off) to trigger the green badge
- Use Subscribe and Save discounts to show a lower displayed price
- Bundle products to increase perceived value per dollar
- Test price points using A/B experiments to find the sweet spot
4. Run A/B Tests with Manage Your Experiments
Amazon’s Manage Your Experiments tool (available to brand-registered sellers) lets you A/B test main images, product titles, A+ Content, and bullet points. This is the most reliable way to improve CTR because it uses real shopper data from your own listings.
Best practices for A/B testing CTR include the following.
- Test one variable at a time for clear results
- Run each test for at least 4 weeks or until statistical significance is reached
- Start with main image tests since they have the biggest impact
- Document results and build a library of winning variations
5. Improve Keyword Targeting and Relevance
Low CTR often results from ads showing up for irrelevant search terms. If someone searches for “red leather wallet” and your ad shows a blue nylon wallet, they will not click. Tightening keyword relevance is one of the fastest ways to improve CTR.
Steps to improve targeting relevance are outlined below.
- Review your Search Term Report weekly and identify low-CTR search terms
- Add irrelevant terms as negative keywords (exact or phrase match)
- Shift budget from broad match to phrase and exact match for proven keywords
- Use keyword research tools to find high-intent, lower-competition keywords
- Separate branded and non-branded keywords into different campaigns for better control
6. Use Negative Keywords Aggressively
Negative keywords prevent your ads from showing on irrelevant searches, which directly improves CTR by eliminating wasted impressions. Most sellers under-use this feature.
A practical negative keyword workflow includes the following steps.
- Pull your Search Term Report every 7 days
- Filter for search terms with 100+ impressions and 0 clicks
- Filter for search terms with CTR below 0.15%
- Add these as negative exact match keywords
- Create a master negative keyword list for common irrelevant terms in your category
7. Optimize Ad Placements with Bid Adjustments
Use Amazon’s “Adjust Bids by Placement” feature to allocate more budget toward Top of Search, where CTR is highest. This is found in the Campaign Settings within the Advertising Console.
Below is a recommended starting framework for placement bid adjustments.
| Placement | Suggested Bid Increase | Rationale |
|---|---|---|
| Top of Search | +50% to +200% | Highest CTR and conversion rates |
| Product Pages | 0% to +25% | Lower CTR but useful for conquest |
| Rest of Search | 0% (default) | Baseline, monitor and adjust |
Monitor ACoS by placement weekly. If Top of Search delivers strong ROAS even at higher bids, continue increasing. If Product Pages show poor conversion, reduce or remove the adjustment.
8. Use Sponsored Brands Video Ads
Sponsored Brands Video (SBV) ads consistently deliver the highest CTR among all Amazon ad formats. Video ads auto-play in search results and immediately capture attention in a grid dominated by static images.
Key elements of high-CTR video ads include the following.
- First 3 seconds must hook the viewer (show the product in use immediately)
- Keep videos 15 to 30 seconds long
- Add text overlays since most shoppers browse with sound off
- Focus on one primary benefit per video
- Include a clear call to action at the end
9. Build Reviews and Social Proof
More reviews and higher ratings directly improve CTR. Shoppers use review counts and star ratings as a quick quality filter before deciding which listing to click.
Legitimate strategies to accelerate review velocity include the following.
- Enroll in Amazon Vine for new products (up to 30 units)
- Use Amazon’s “Request a Review” button within 4-30 days of delivery
- Include product inserts that encourage honest feedback (without incentivizing positive reviews)
- Fix product quality issues that generate negative reviews
- Respond to negative reviews professionally using the brand response feature
10. Optimize for Mobile Shoppers
Over 70% of Amazon traffic comes from mobile devices, according to Statista’s 2024 e-commerce data. Mobile search results display fewer characters of your title and a smaller image, making every pixel and word count.
Mobile-specific optimization tips include the following.
- Front-load your title with the most critical 60 to 80 characters
- Ensure your main image is clear and recognizable at small sizes
- Verify your price, rating, and badges display properly on mobile
- Test how your listing appears by searching for your keywords on the Amazon mobile app
11. Use Dayparting to Show Ads During Peak Hours
Showing your ads during hours when your target audience is most active can improve CTR because shoppers browsing during peak intent periods are more likely to click. While Amazon does not natively support dayparting for all sellers, third-party tools like Pacvue, Perpetua, and Scale Insights offer this functionality.
Common high-CTR windows for consumer products include the following.
- 7:00 AM to 10:00 AM (morning browsing)
- 12:00 PM to 2:00 PM (lunch break shopping)
- 7:00 PM to 11:00 PM (evening shopping, typically highest conversion)
12. Monitor and Beat Competitor Listings
Regularly analyze the top 5 listings for your primary keywords. Look at their images, titles, prices, review counts, and badges. Identify what they do well and find gaps you can exploit.
A competitive analysis checklist should cover the following areas.
- Main image quality and composition versus yours
- Title structure and keyword usage
- Price positioning and any active deals or coupons
- Review count and rating comparison
- Badge presence (Best Seller, Amazon’s Choice, etc.)
- A+ Content quality and depth
How Amazon CTR Impacts Organic Ranking
Amazon’s search algorithm considers CTR as a relevance signal. When shoppers consistently click on your listing for a given search term, it tells Amazon that your product is a strong match for that query. Over time, this can improve your organic search position.
The relationship between CTR and organic ranking works through Amazon’s relevance feedback loop, which follows these steps.
- Your product appears in search results (either organically or through ads)
- A shopper clicks on your listing, generating a positive engagement signal
- If the shopper also converts, that reinforces the relevance signal
- Amazon gradually increases your organic visibility for that keyword
- Higher organic visibility leads to more impressions and potentially more clicks
This is why many advanced sellers use PPC not just for direct sales, but as a ranking tool. Running Sponsored Products ads on target keywords generates clicks and sales that feed into organic ranking improvements.
Key points about CTR and ranking include the following.
- CTR alone does not guarantee ranking improvements. Amazon also considers conversion rate, sales velocity, and relevancy
- A high CTR with a low conversion rate can actually hurt you, as it signals that your listing attracts clicks but fails to satisfy shoppers
- The most powerful ranking signal is CTR combined with a strong conversion rate
- Search Query Performance data in Brand Analytics shows your organic click share, which is a useful proxy for tracking ranking progress
Amazon CTR vs Conversion Rate: How They Work Together
CTR and conversion rate are two sides of the same funnel. CTR measures how many people click on your listing, while conversion rate measures how many of those clickers actually buy. You need both metrics working together for a profitable Amazon business.
Below is a comparison showing how CTR and conversion rate interact to drive different business outcomes.
| Scenario | CTR | Conversion Rate | Outcome |
|---|---|---|---|
| High CTR, High CVR | 0.70% | 15% | Best case. Strong sales, low ACoS |
| High CTR, Low CVR | 0.70% | 5% | Lots of clicks but few sales. High ACoS |
| Low CTR, High CVR | 0.20% | 15% | Few clicks but strong conversion. Needs more visibility |
| Low CTR, Low CVR | 0.20% | 5% | Worst case. Listing needs full overhaul |
When you see high CTR but low conversion rate, the problem is usually on your product detail page (poor images, weak bullet points, pricing issues, or lack of reviews). When you see low CTR but high conversion rate, your listing converts well but is not compelling enough in search results to attract clicks.
The ideal approach in 2026 is to optimize both metrics simultaneously rather than focusing on one in isolation.
How to Improve Amazon CTR With Main Image
Your main image plays the biggest role in driving CTR on Amazon. While factors like title, price, and discounts do influence CTR, it’s usually the main image that makes or breaks it. A well-designed main image can grab attention within seconds. Below are proven main image design hacks you can use to improve your Amazon CTR.
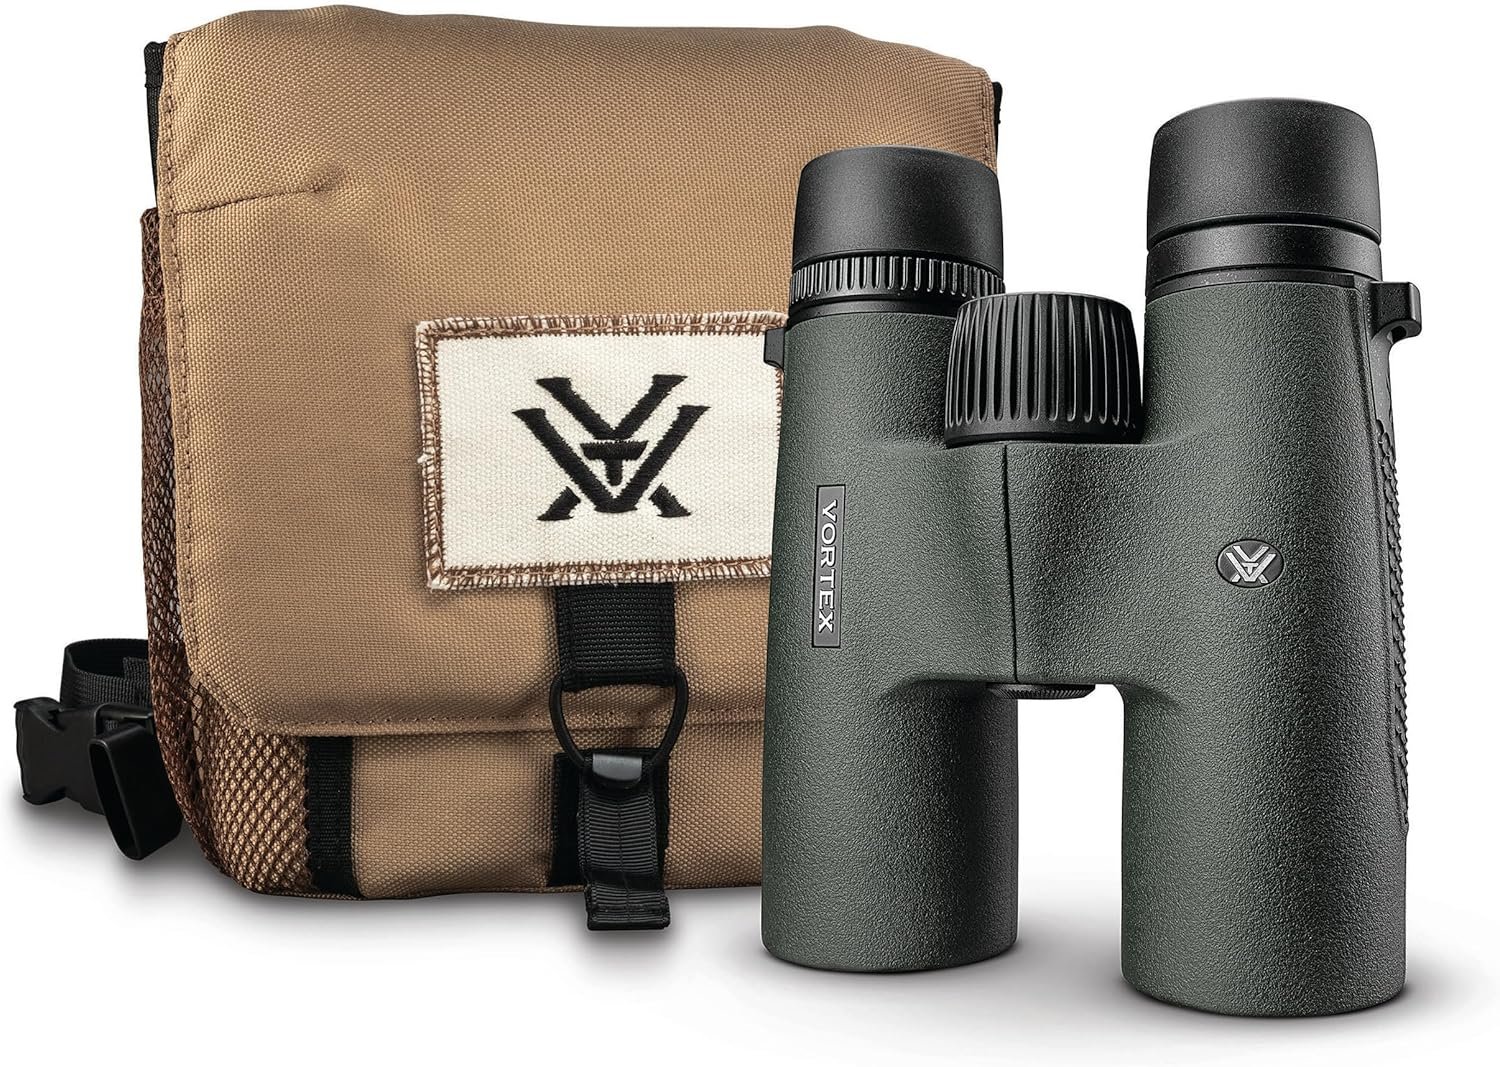
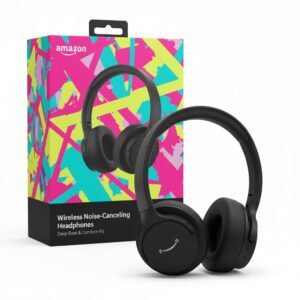
1. Show Product + Packaging Together
Placing your product next to its retail box or bag is a simple move with a powerful psychological effect. It builds instant trust and signals this is a legitimate, branded product, not a generic item. It also increases the perceived value, making it feel more premium and giftable. Example below illustrates this method of main image presentation.
2. Use 3D Renderings / CGI Mockups
Ever wonder why some product images look too perfect? They probably aren’t real photos. Using 3D renderings gives you complete control over lighting, angles, and textures. You can create a flawless, hyper-realistic shot that traditional photography can’t always match, making your product look sharper than competitors’.
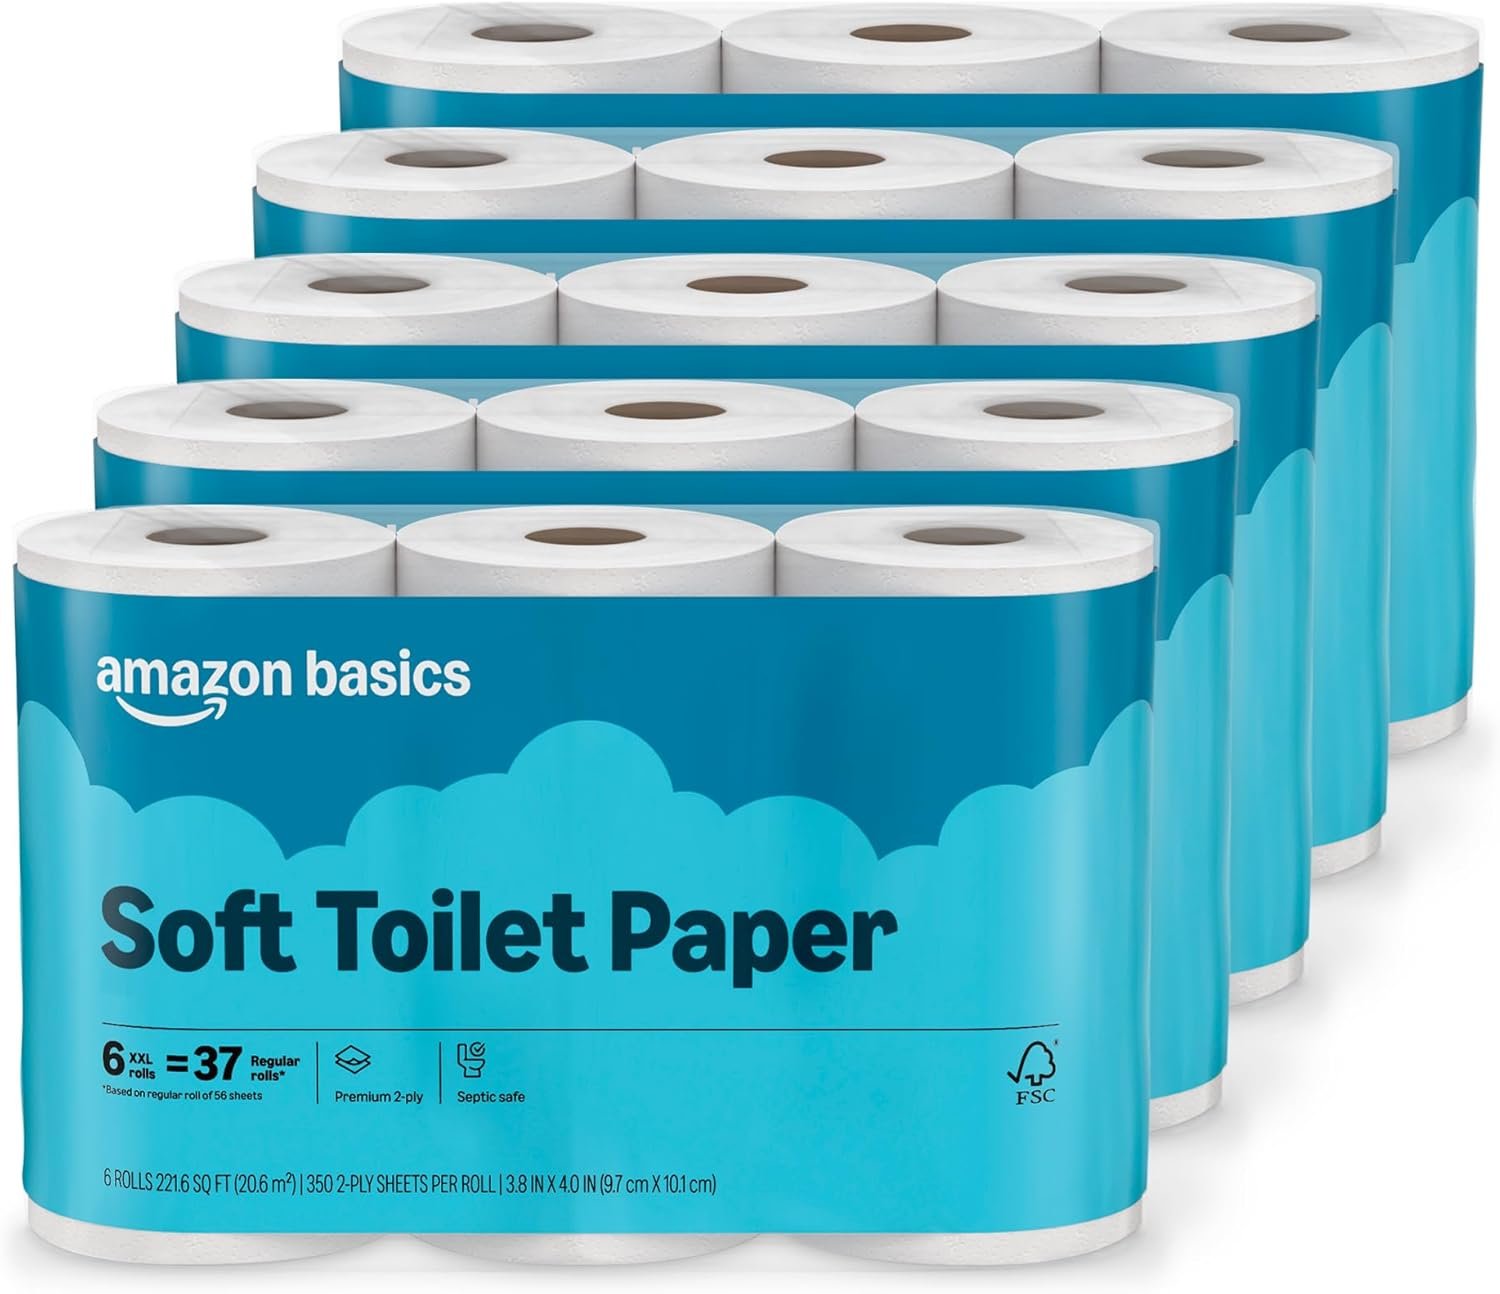
3. Main Keyword Overlay on Packaging
While you can’t add text directly to the image, you can design your packaging to include key terms. For example, your box could clearly state “Soft Toilet Paper” as shown in example image below. Featuring this packaging in the main image reinforces relevance without violating Amazon’s terms of service.
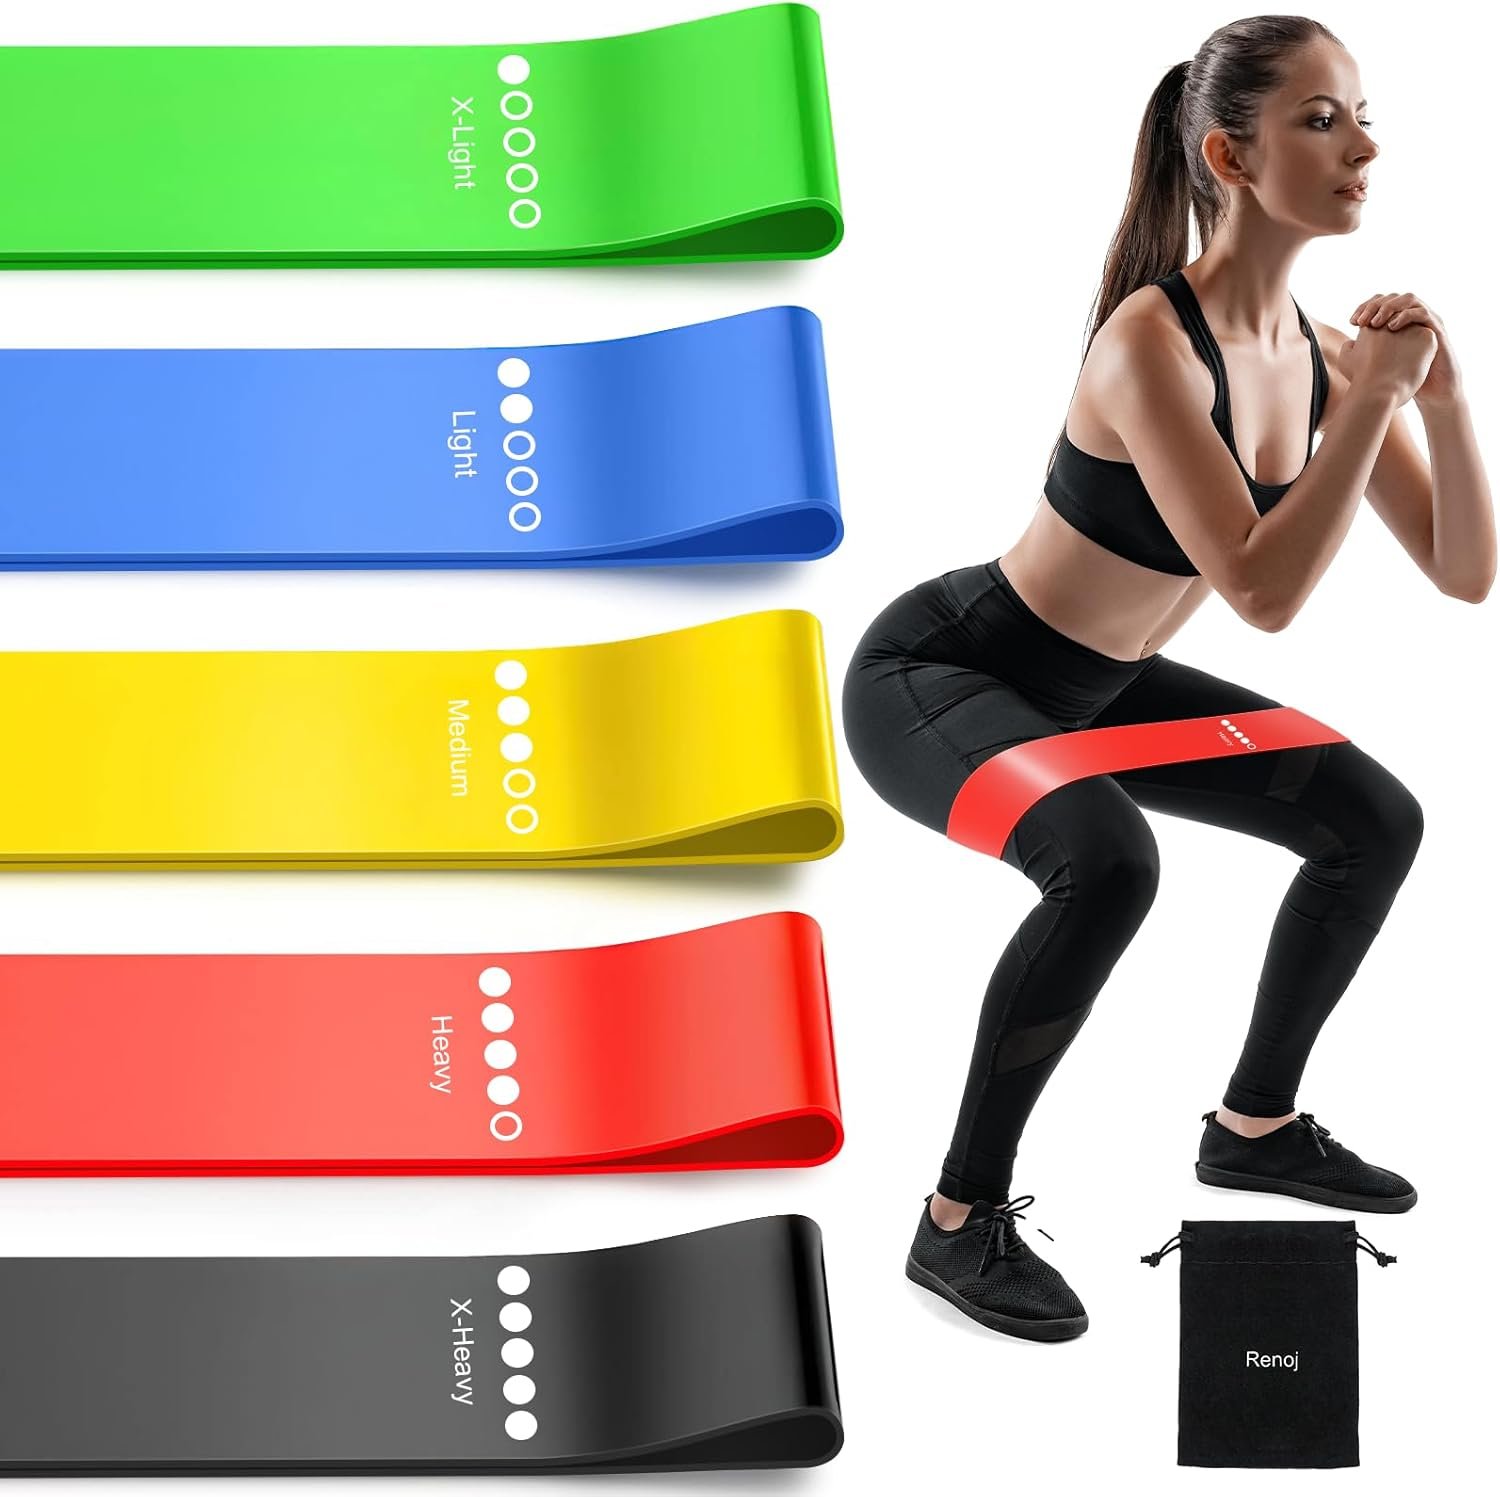
4. Hint at a Lifestyle Element
Amazon’s rules require a pure white background, but that doesn’t mean your image has to be sterile. You can cleverly hint at how the product is used. Imagine a woman exercising with “Resistance Bands” visible on the main image. These touches add a human element and help shoppers imagine using your item, as long as the background remains white. Be sure you’re still compliant by checking the official Amazon image requirements.
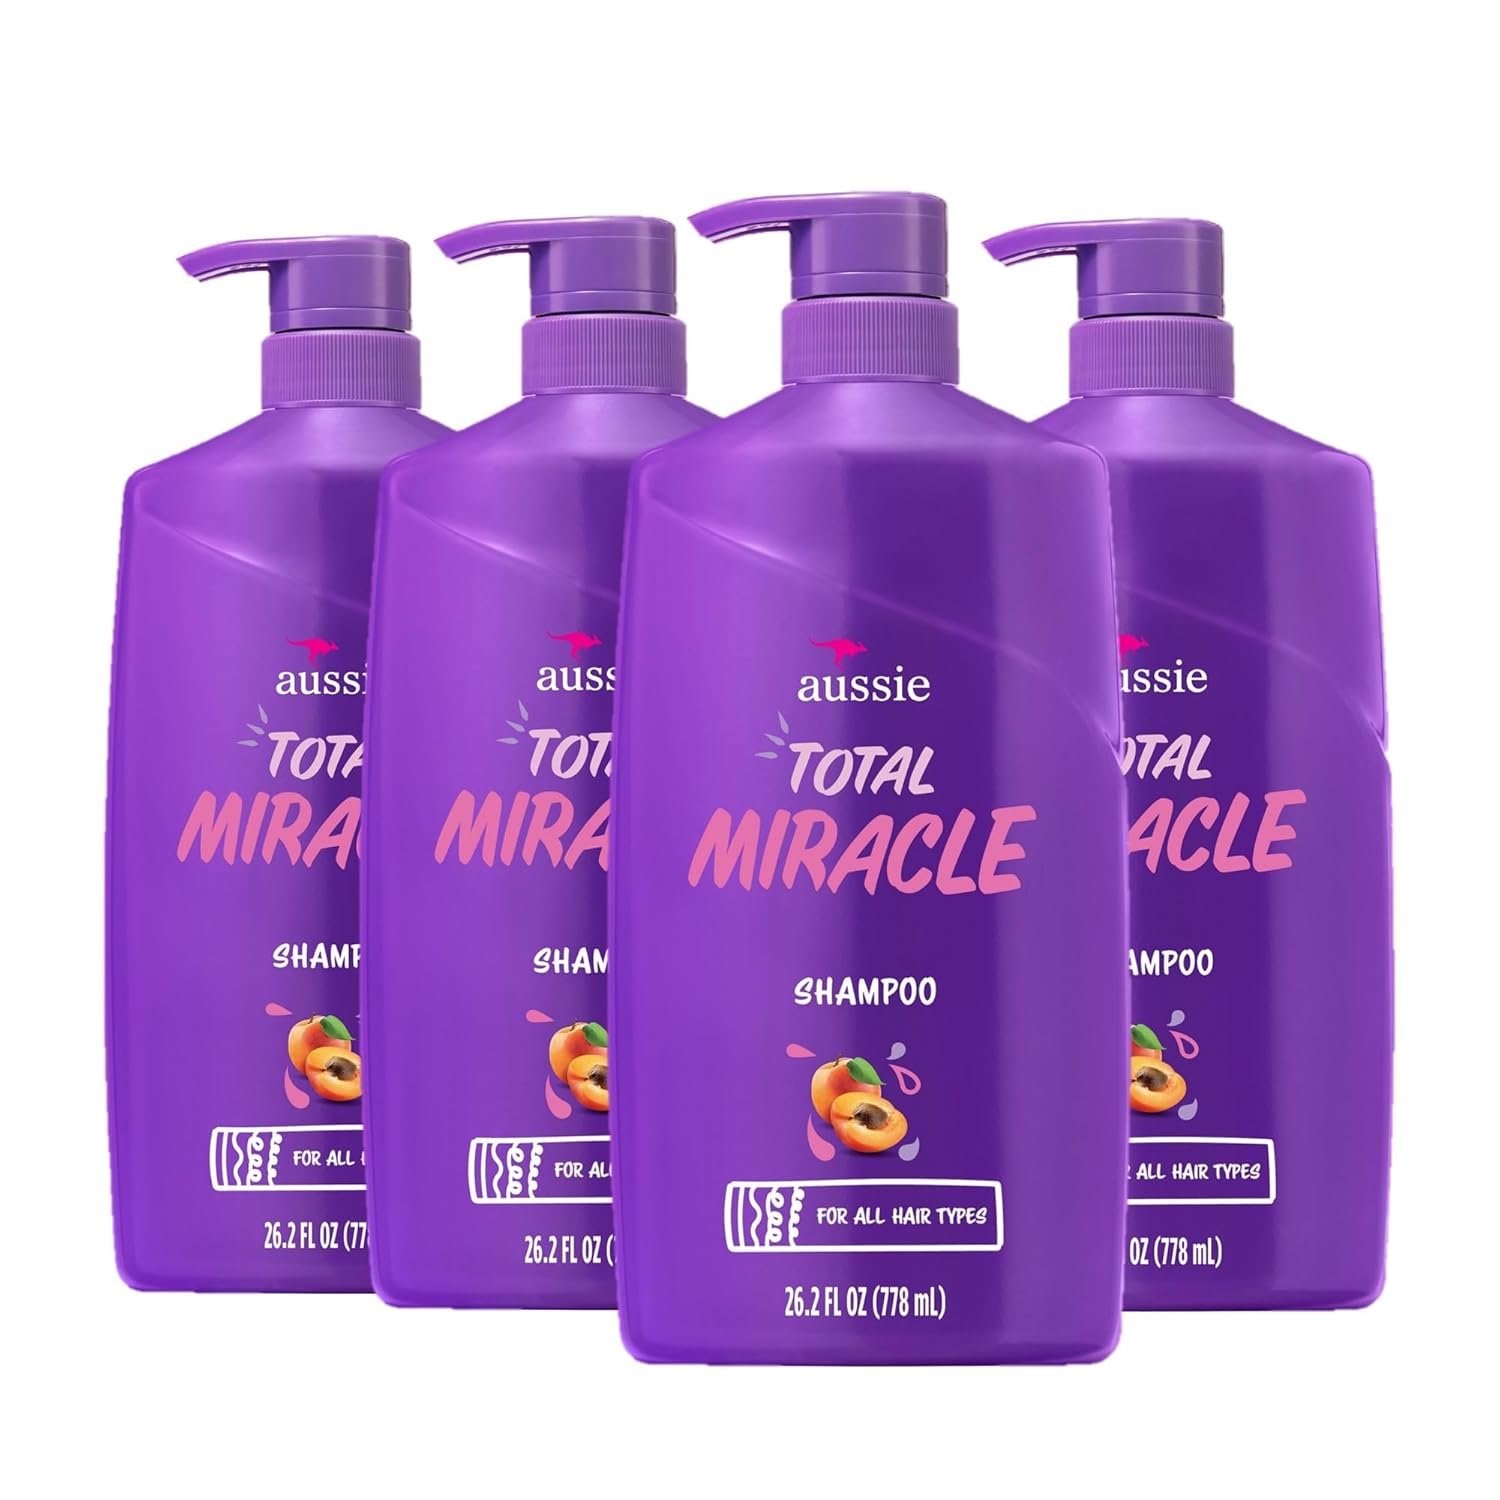
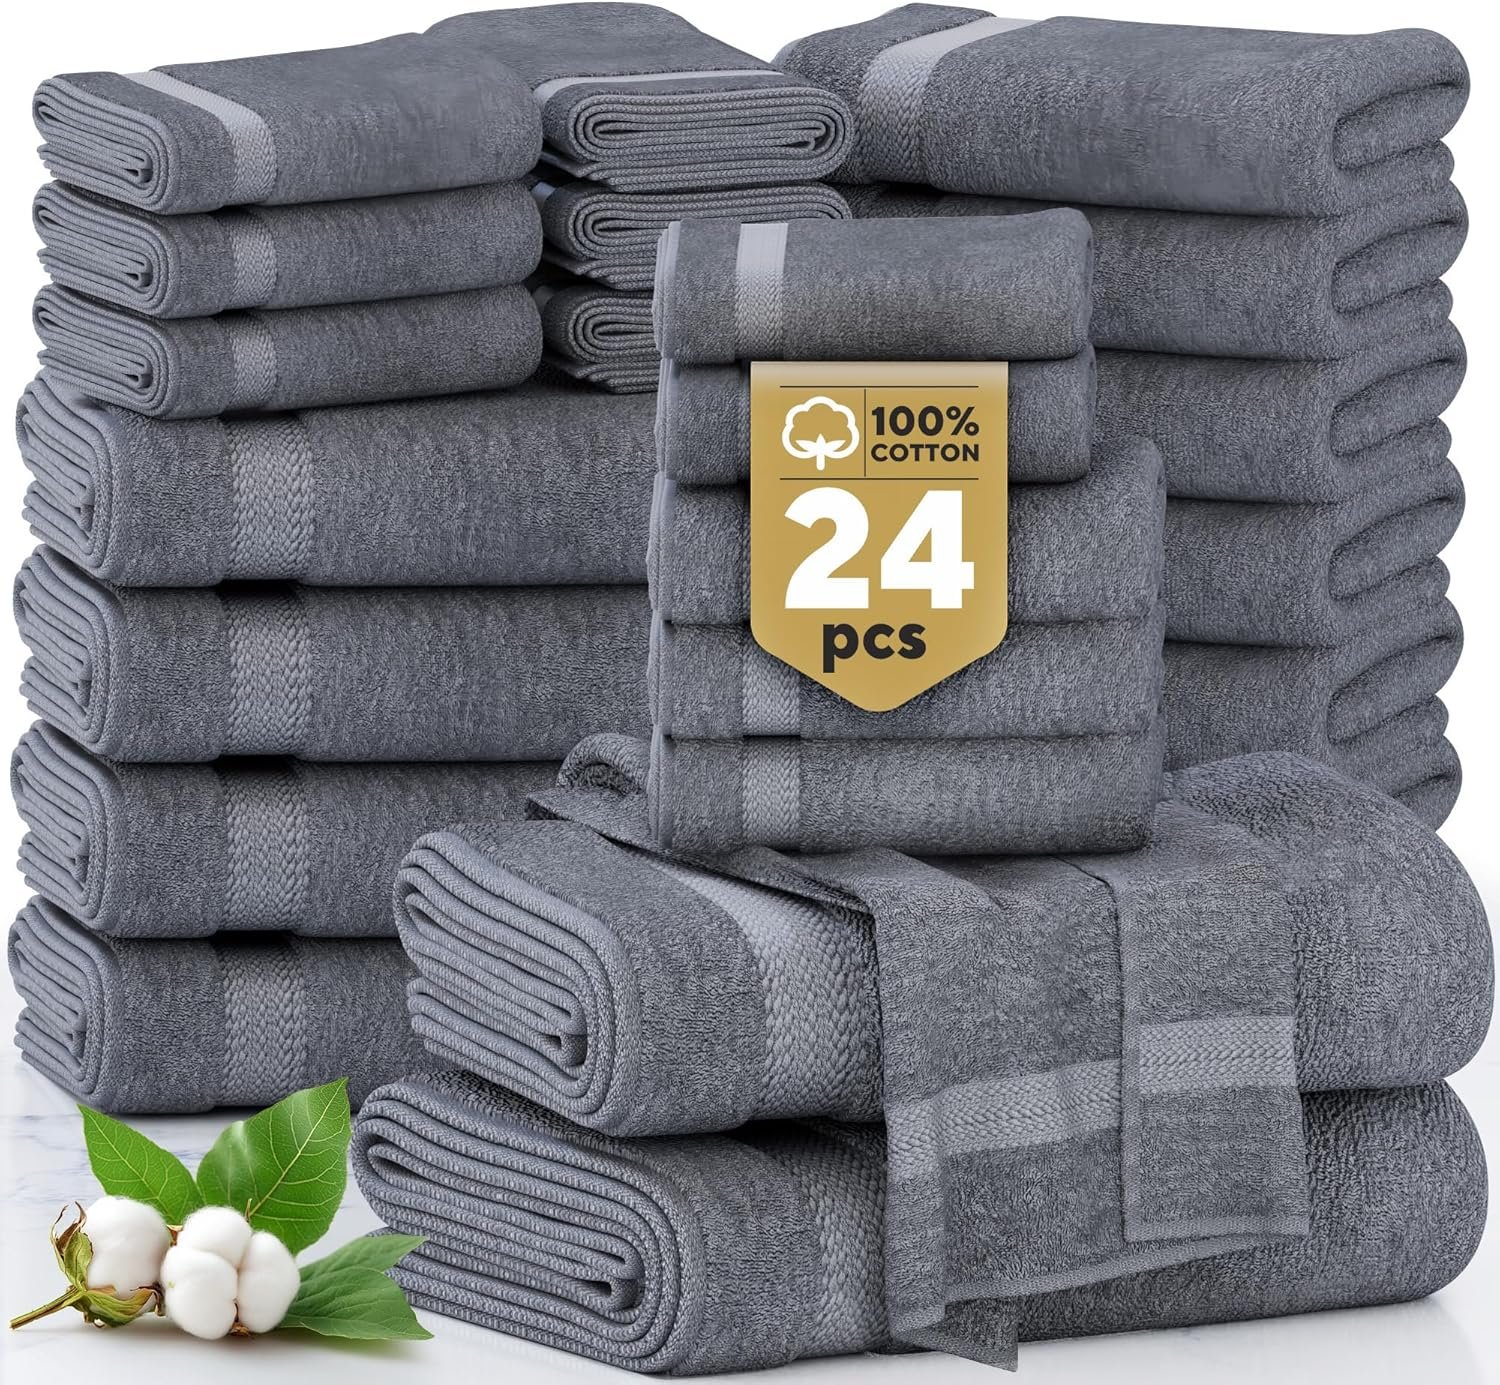
5. Use a Comparison Layout
If you’re selling a multi-pack, show both units clearly. A listing for a “4-Pack” of shampoo should have 4 bottles visible so the customer immediately understands the value they are getting. This prevents confusion and highlights the quantity. You can also remove a background from a picture of multiple items to compose them perfectly.
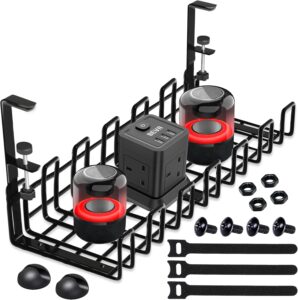
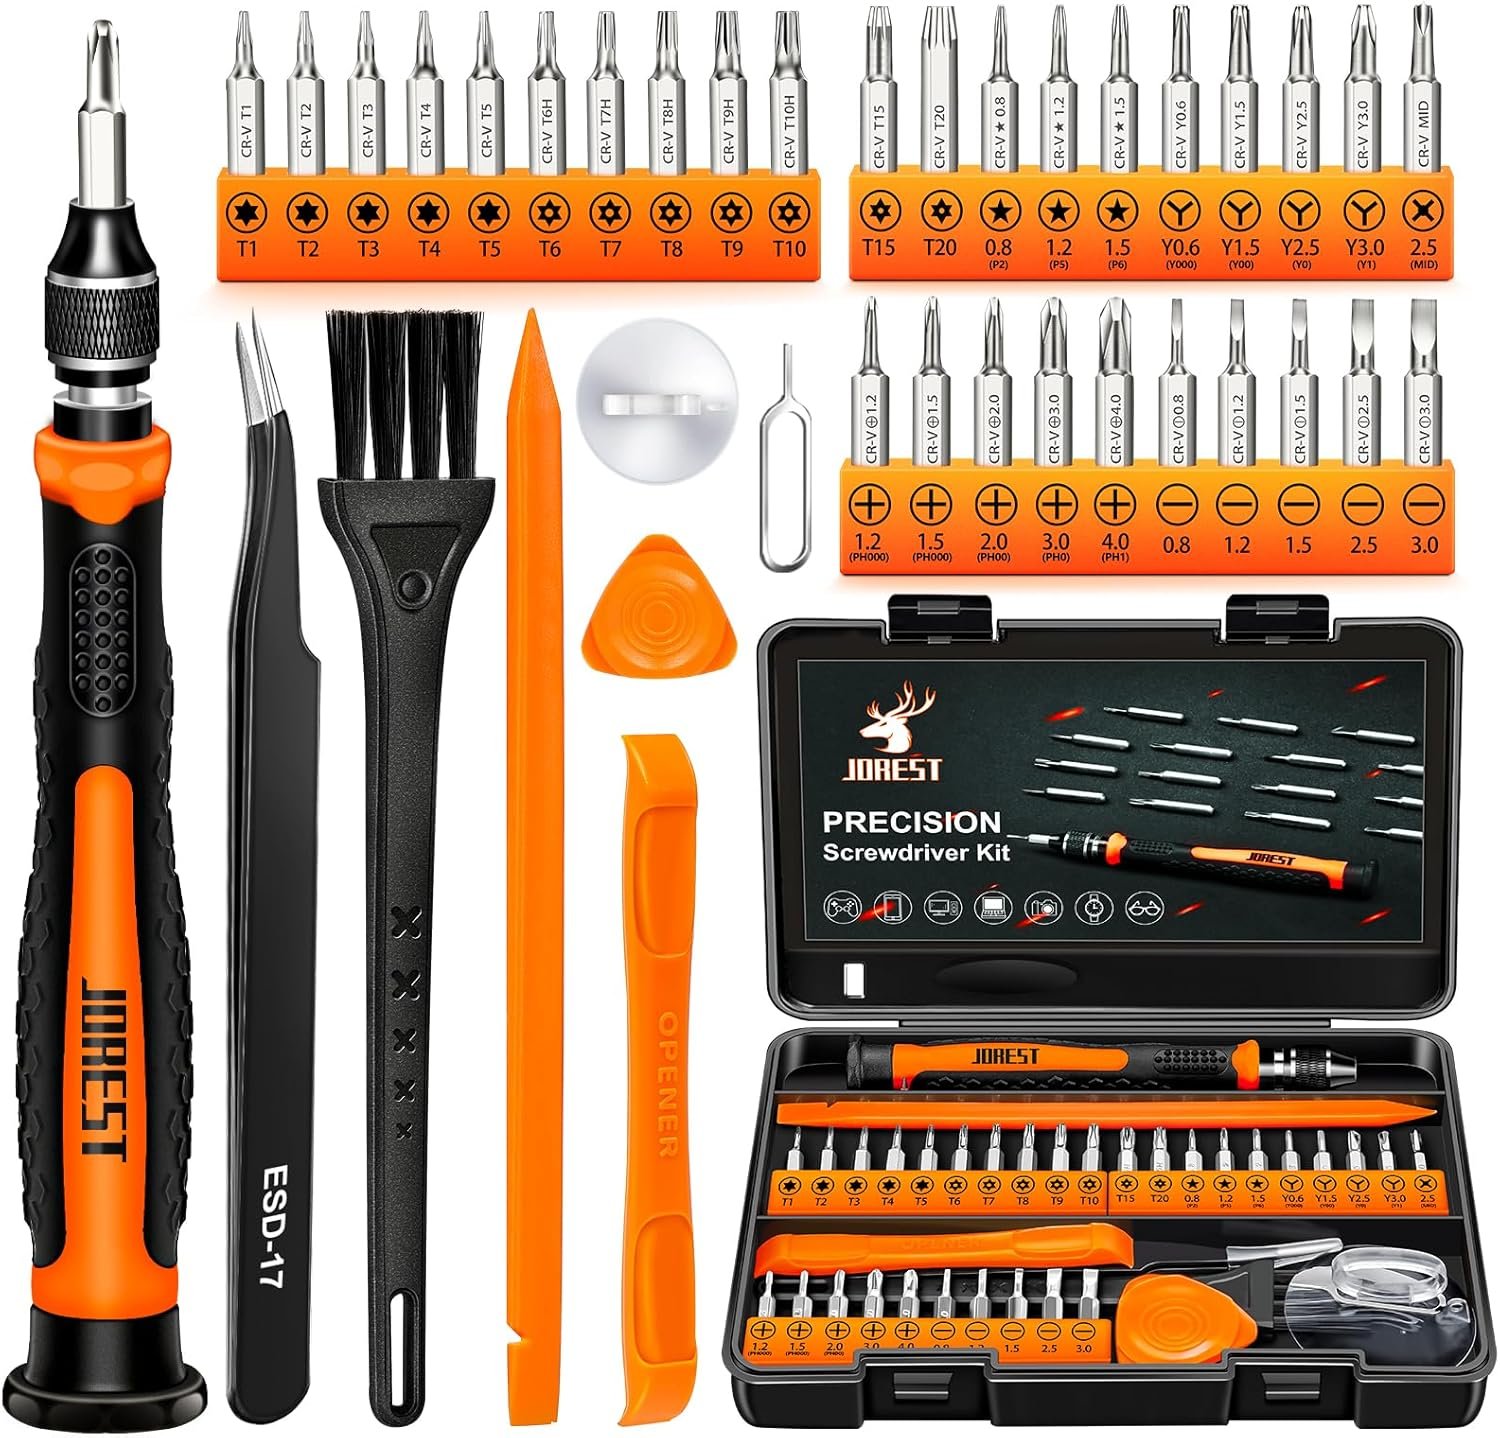
6. Highlight Accessories / What’s Included
If your product comes with essential accessories, show them in the main image. A screwdriver listing that shows the included bits, battery, and brushes answers a key question and communicates better value than a competitor who only shows the screwdriver.
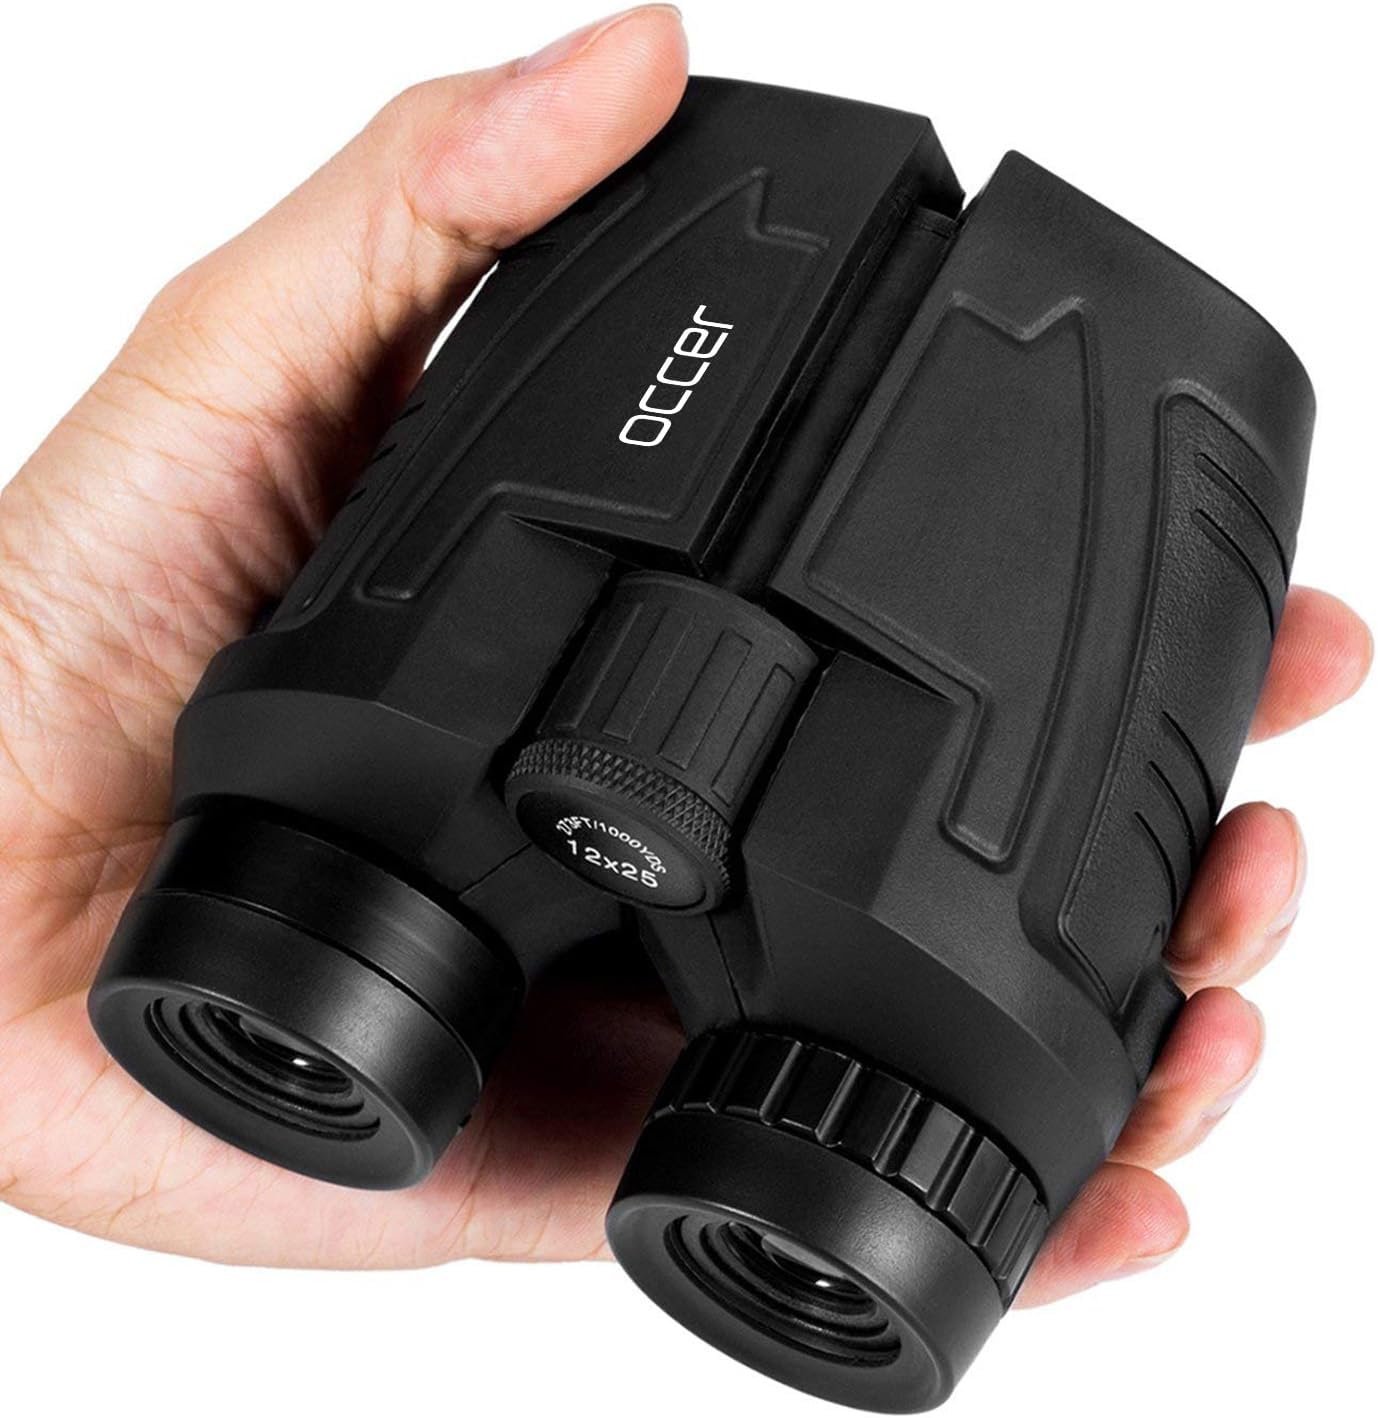
7. Add Size Context
One of the biggest worries for online shoppers is size. “Is it going to be bigger or smaller than I think?” Eliminate that guesswork. Including a hand holding the item or a common object for scale gives immediate context and builds the confidence a shopper needs to click.
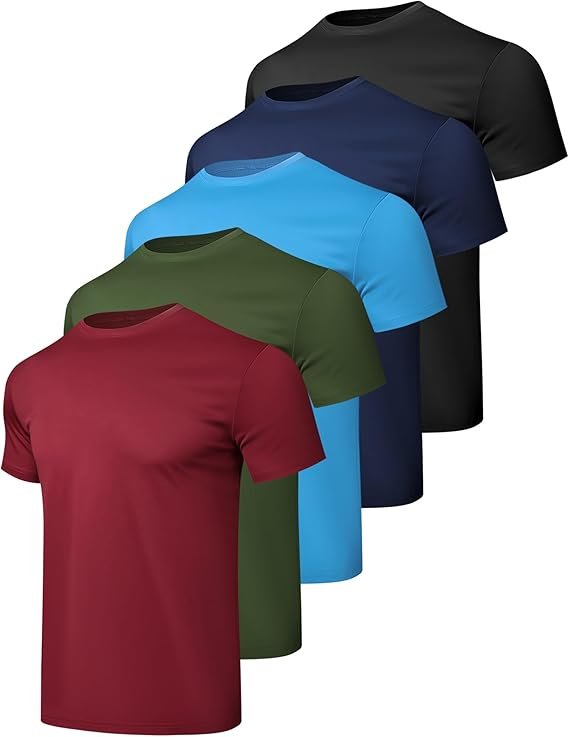
8. Show Color Variations Subtly
If you sell a product in multiple colors, you can sometimes arrange a few of them in a single, compliant image. For example, a stack of three different colored t-shirts can work as a main image, signaling to the customer that they have choices.
9. Use a Hero Angle
Never shoot your product dead-on. It’s flat and boring. Instead, use a slight three-quarter tilt, or a “hero angle.” This simple photography trick gives the product more depth and a dynamic, three-dimensional feel that naturally draws the eye. This is especially important for Amazon Brand Registry benefits as you build a premium identity. Example below illustrates this method of main image presentation.

10. Add Shadows or Reflections for Depth
A subtle drop shadow or a soft reflection can make your product look like it’s sitting on a surface instead of floating in a white void. This adds professionalism and depth, helping your image stand out against competitors’ flat photos.

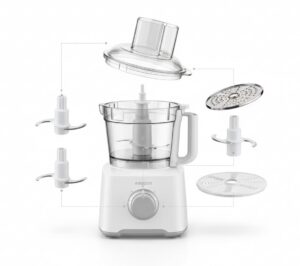
11. Create an “Exploded View”
For products with multiple parts, like a food processor with different blades, an “exploded view” can be very effective. It shows all the components neatly arranged, communicating functionality and value at a glance.
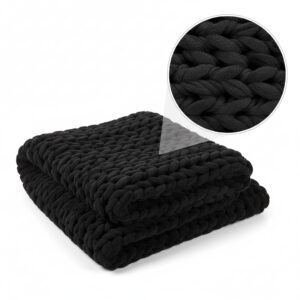
12. Zoom on Texture or a Key Feature
If your product’s material or a specific feature is a major selling point (like the weave of a high-end fabric or a waterproof seal), you can use a small, magnified inset circle in the main image to highlight it. This draws attention to what makes your product special.
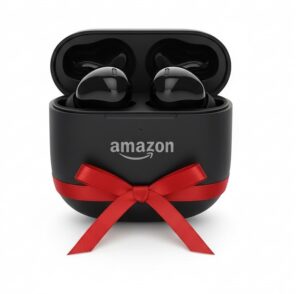
13. Use Seasonal or Thematic Props
For giftable items, adding a simple, compliant prop can make a huge difference. A small gift ribbon for the holidays or a pumpkin for a fall-themed product can make your listing feel more relevant and timely, encouraging clicks during peak shopping seasons.
14. Apply Contrast Color Tricks
Your product itself can be used to create contrast against the white background. If you sell a black product, for instance, it will naturally stand out. You can also use brightly colored packaging to make your listing pop in a sea of white.
15. Present Bundles Neatly
If you’re selling a bundle, don’t just throw the items together. Arrange them artfully. A well-organized layout makes the bundle look more valuable and professional, helping customers quickly understand everything they’re getting.
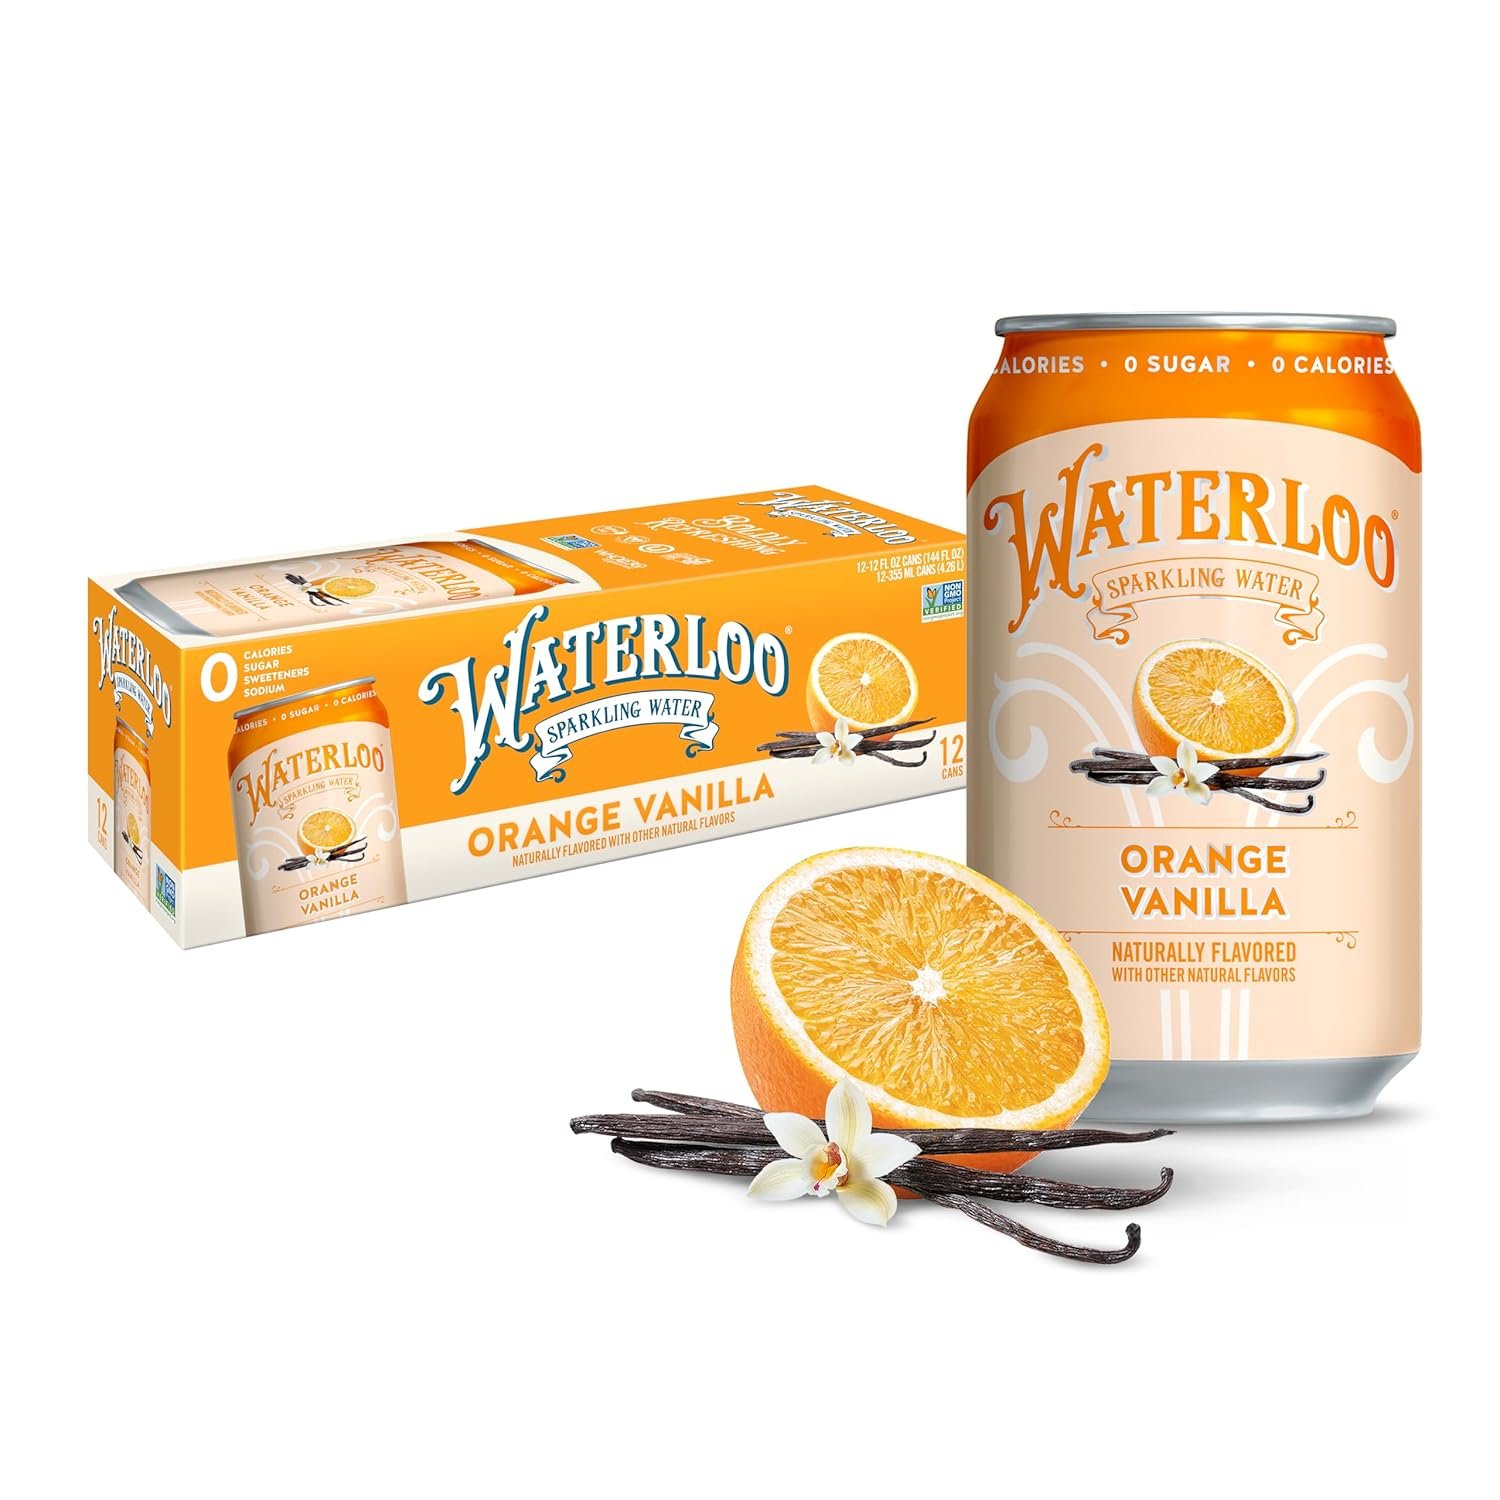
16. Show Ingredients
If you are offering a product that contains ingredients such as fruits, it is beneficial to display these ingredients alongside the product. This approach helps customers gain a clear understanding of what your product includes.
Testing & Iteration

Changing your main image or title without tracking the results is just guessing. You need a reliable way to know if your changes are actually improving your Amazon click through rate.
Use Manage Your Experiments (A/B test)
The best place to start is Amazon’s own “Manage Your Experiments” (MYE) tool. It lets you run a true A/B split test on your title, main image, or A+ Content. Amazon shows one version to 50% of shoppers and the other version to the other 50%. After a few weeks, it declares a winner based on real data. It’s the most scientific way to prove your changes are working.
Use PickFU to A/B Test Main Images
Sometimes you need answers fast. Third-party tools like PickFU are great for this. You can upload two different main images and get feedback from a panel of your ideal customers in hours. They won’t just vote on which one they’d click; they’ll tell you why. This quick, unbiased data is incredibly valuable for improving your Amazon click through rate before you even update your live listing.
Track CTR Shifts in Reports
Once a change is live, keep an eye on your performance in Seller Central.
- Sponsored Products Reports: Check the CTR for your target keywords in your campaign manager. If that number starts climbing after an update, it’s a great sign your change is working. Our guide on what PPC is on Amazon can help you read these reports.
- Search Query Performance: This dashboard, under the Brands tab, is a goldmine for organic data. It shows you the click-through rate for the exact search terms shoppers use to find you. It’s the perfect way to see if your title and image optimizations are connecting with customers.
Swap Images in 2-Week Cycles
You can run a manual test to see the impact on main image on CTR. Run one image for two weeks, record the CTR from your reports, then switch to the new image for two weeks and compare the results. It’s less precise but still gives you a solid directional idea of what works best.
Frequently Asked Questions
What is a good CTR on Amazon?
A good CTR on Amazon depends on the ad type. For Sponsored Products, a CTR above 0.50% is considered good, while anything above 0.70% is excellent. For Sponsored Brands, aim for 0.35% or higher. Sponsored Display typically has lower CTRs, so 0.25%+ is considered solid. Always compare your performance against your specific category benchmarks rather than marketplace-wide averages.
Why is my Amazon CTR so low?
Low CTR is usually caused by one or more of these factors: poor main image quality, irrelevant keyword targeting, uncompetitive pricing, low review count or rating, or unappealing product titles. Start by reviewing your Search Term Report for irrelevant queries and compare your listing’s visual appeal against the top 5 competitors for your main keywords.
Does Amazon CTR affect organic ranking?
Yes, CTR is one of the signals Amazon’s algorithm uses to determine organic ranking. When shoppers consistently click on your listing for a specific search term, Amazon interprets it as a relevance signal and may improve your organic position for that keyword. However, CTR works best as a ranking signal when combined with strong conversion rates and sales velocity.
What is the average CTR for Amazon Sponsored Products?
The average CTR for Amazon Sponsored Products is approximately 0.40% based on 2024-2025 industry data. This varies by category, with niche categories like Pet Supplies averaging closer to 0.52% and competitive categories like Electronics averaging around 0.30%.
Is CTR more important than conversion rate on Amazon?
Neither metric is more important in isolation. CTR drives traffic to your listing, while conversion rate turns that traffic into sales. A high CTR with a low conversion rate leads to wasted ad spend. A low CTR with a high conversion rate means you are not getting enough visibility. The goal is to optimize both simultaneously for the best ACoS and total sales.
How does Amazon’s Choice badge affect CTR?
The Amazon’s Choice badge can increase CTR by approximately 15% to 25% based on seller-reported case studies. The badge adds credibility and stands out visually in search results, making shoppers more likely to click. You cannot directly apply for this badge, as Amazon awards it based on a combination of factors including relevancy, price, availability, shipping speed, and customer satisfaction.