Amazon Best Seller Rank (also called Amazon Sales Rank) is a numerical ranking that Amazon assigns to every product that has recorded at least one sale. The rank reflects how well a product sells compared to all other products within the same category. A lower BSR number means stronger sales performance.
You can find a product’s BSR on its detail page, typically listed under the “Product Information” or “Additional Information” section. Every product can hold a BSR in its main (parent) category and in one or more subcategories simultaneously.
Here are the core characteristics of Amazon BSR.
- BSR is category-specific, so a BSR of 500 in Electronics is not comparable to a BSR of 500 in Books
- It is a relative ranking, not an absolute sales count
- Every product with at least one recorded sale receives a BSR
- A single product can have multiple BSRs across different categories and subcategories
- BSR appears on both Amazon Seller Central reports and the public product listing page
BSR is not the same as your organic search position for a keyword. Your keyword ranking determines where your product appears in search results. BSR is a post-sale metric that reflects purchase velocity relative to competitors in your category.
How Is Amazon BSR Calculated?
Amazon does not publicly disclose the exact formula behind BSR. However, through extensive seller testing and reverse-engineering by the community, the core mechanics are well understood.
BSR calculation relies primarily on two inputs: recent sales velocity and historical sales performance. Amazon weights recent sales more heavily, which is why BSR can spike dramatically after a single strong sales day and drop just as quickly during a slow period.
The key factors that influence BSR calculation include the following.
- Recent sales volume. The most dominant factor. A burst of orders in the past few hours will push BSR down (improve it) almost immediately
- Historical sales consistency. Sustained sales over days and weeks help stabilize BSR and prevent extreme fluctuations
- Relative category performance. BSR is competitive. If your sales stay flat but competitors increase their volume, your BSR will rise (worsen)
- Sales from all channels. Both FBA and FBM orders, as well as Subscribe & Save and B2B transactions, count toward BSR
- Organic and paid sales. Units sold through Amazon PPC and organic search both contribute equally to BSR
What Does NOT Affect BSR Directly
Several factors that sellers commonly assume influence BSR have no direct impact on the calculation.
- Product reviews and star ratings
- Listing traffic or page views without a purchase
- Pricing changes (unless they result in more or fewer sales)
- Advertising spend (only the resulting sales matter, not the spend itself)
- Wish list additions or cart additions without checkout
BSR is purely a sales-driven metric. Everything that improves BSR does so by increasing the rate at which customers complete purchases.
How Often Does Amazon Update BSR?
Amazon recalculates BSR every one to two hours. This makes it one of the most dynamic metrics on the platform. A single large order can visibly move your BSR within the same day.
However, the hourly update does not mean BSR only reflects the last hour of sales. The calculation uses a weighted rolling window that emphasizes recent sales while still factoring in performance over the past several days.
Here is how BSR typically responds to different sales scenarios.
- Sales spike (e.g., 50 units in one hour). BSR can improve by thousands of positions within 2 to 4 hours
- Steady daily sales (e.g., 10 units per day). BSR stabilizes in a narrow range and fluctuates modestly hour to hour
- Sales stop completely. BSR begins decaying within 6 to 12 hours and can worsen dramatically within 48 to 72 hours
- Returning after stock-out. BSR recovery typically takes 2 to 4 weeks of consistent sales to return to pre-stock-out levels
BSR Decay: What Happens When Sales Stop
BSR decay is a concept that many sellers underestimate. When your product stops selling, BSR does not freeze. It actively worsens because competitors continue making sales while your product does not.
The decay accelerates over time. Products that were consistently selling 20 units per day and suddenly stop can see their BSR drop from the low thousands to 50,000+ within a single week. Products with a long sales history tend to decay slightly slower than products with a short track record, but the decline is inevitable without new orders.
What Is a Good BSR on Amazon?
There is no single number that qualifies as a “good” BSR across all categories. A BSR of 5,000 in the Clothing category (which has tens of millions of listings) is outstanding. The same BSR of 5,000 in a niche industrial category with only 30,000 products is moderate.
The right way to evaluate your BSR is by considering category size, competition density, and your business model.
Below is a general framework for interpreting BSR across popular Amazon US categories.
| Category | Estimated Listings | BSR Under This = Strong | BSR Under This = Solid |
|---|---|---|---|
| Books | 60 million+ | 5,000 | 50,000 |
| Electronics | 15 million+ | 3,000 | 15,000 |
| Home & Kitchen | 20 million+ | 5,000 | 20,000 |
| Toys & Games | 8 million+ | 3,000 | 12,000 |
| Beauty & Personal Care | 10 million+ | 3,000 | 15,000 |
| Sports & Outdoors | 12 million+ | 5,000 | 20,000 |
| Clothing, Shoes & Jewelry | 50 million+ | 10,000 | 50,000 |
| Pet Supplies | 4 million+ | 2,000 | 10,000 |
| Tools & Home Improvement | 8 million+ | 3,000 | 15,000 |
| Health & Household | 8 million+ | 3,000 | 12,000 |
These ranges reflect general industry benchmarks, not official Amazon data. Use them as directional guidelines rather than absolute targets.
Why Subcategory BSR Matters More Than You Think
Most sellers focus only on their main category BSR, but subcategory BSR is often more actionable. Subcategories are smaller, so achieving a top BSR is more realistic. A #1 BSR in a subcategory also earns the coveted Best Seller Badge, which can significantly boost click-through rates.
Consider these advantages of tracking subcategory BSR.
- Easier to reach #1 and earn the Best Seller Badge
- More granular competitive benchmarking
- Better signal of niche dominance
- Subcategory rankings are visible to shoppers and build trust
Amazon BSR to Sales: Estimation Guide
One of the most common questions sellers ask is how many units a given BSR translates to in actual sales. While the exact conversion depends on category, seasonality, and competition, industry tools have built reasonably accurate estimation models based on millions of data points.
Below is an approximate guide for converting BSR to estimated daily unit sales in a mid-sized Amazon US category like Home and Kitchen.
| BSR Range | Estimated Daily Sales |
|---|---|
| 1 to 50 | 100 to 500+ units |
| 51 to 100 | 50 to 100 units |
| 101 to 500 | 15 to 50 units |
| 501 to 1,000 | 8 to 20 units |
| 1,001 to 5,000 | 3 to 10 units |
| 5,001 to 10,000 | 1 to 5 units |
| 10,001 to 50,000 | 0.5 to 3 units |
| 50,001 to 100,000 | Less than 1 unit daily |
| 100,001+ | Sporadic sales (few per week) |
These estimates are derived from widely-used tools like Jungle Scout’s sales estimator and Helium 10’s Xray. Actual numbers fluctuate based on category volume, time of year, and competitive dynamics.
How to Estimate Monthly Revenue From BSR
You can build a rough revenue estimate using BSR-derived sales data and your product’s selling price. Here is a practical example.
- Product BSR: 2,500 in Home & Kitchen
- Estimated daily sales at that BSR: Approximately 5 to 8 units
- Selling price: $29.99
- Estimated daily revenue: $150 to $240
- Estimated monthly revenue: $4,500 to $7,200
This is a simplified calculation. Your actual revenue depends on your Buy Box percentage, return rate, and whether sales are consistent or spiky. But BSR-based estimation gives you a useful starting point for evaluating product opportunities or benchmarking competitors.
Seasonal BSR Shifts to Watch
BSR is heavily influenced by seasonal demand patterns. A product that sits at BSR 3,000 during normal months might jump to BSR 500 during peak season, then slide to BSR 8,000 in the post-holiday slump.
Key seasonal periods that cause BSR fluctuation include the following.
- Q4 (October through December). Highest overall sales volume across most categories. BSR competition intensifies dramatically
- Prime Day (typically July). Major spike in sales velocity. Products running deals can see BSR improve by 80% or more in 24 hours
- Post-Holiday January. Sharp decline in consumer spending. Many products see BSR worsen significantly
- Back-to-School (August to September). Category-specific spikes in office supplies, electronics, and clothing
- Spring seasonal categories. Garden, outdoor, and fitness products often peak in March through May
Understanding these patterns helps you avoid overreacting to natural BSR fluctuations and focus on long-term trends instead.
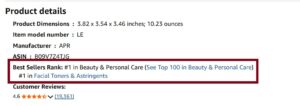
The Amazon Best Seller Badge
The Amazon Best Seller Badge is the bright orange label that appears on product listings and search results for the #1 ranked product in any given category or subcategory. It is one of the most powerful trust signals on the platform.
![]()
Earning this badge requires achieving and maintaining a BSR of #1 in at least one category or subcategory. The badge updates in near real-time as BSR changes, so it can shift between competing products multiple times per day in competitive categories.
Here is what sellers should know about the Best Seller Badge.
- It is awarded automatically when a product reaches #1 BSR in any category or subcategory
- Products can display the badge for main categories, subcategories, or both
- The badge appears in search results, significantly increasing click-through rates
- There is no application process. It is entirely based on sales performance
- Industry data suggests the badge can increase conversion rates by 10% to 25%
Strategic Category Selection for the Badge
One underutilized strategy is selecting or adjusting your product’s category placement to compete in a subcategory where reaching #1 is more achievable. A product that cannot realistically compete for #1 in “Home & Kitchen” might dominate in a specific subcategory like “Kitchen Drawer Organizers.”
This requires careful analysis of the following.
- Current #1 BSR holder in target subcategory and their approximate sales volume
- Whether your product legitimately fits the subcategory (Amazon enforces relevance)
- The subcategory’s visibility and traffic volume
- How frequently the #1 position changes hands, which indicates competitiveness
Amazon BSR in Parent and Child ASINs
Products with variations (size, color, style) use a parent-child ASIN structure on Amazon. BSR behavior in this structure has nuances that many sellers overlook.
The parent ASIN receives a BSR that reflects the combined sales of all child variations. Each child ASIN also has its own individual BSR. The parent BSR is typically much stronger (lower number) because it aggregates sales across all options.
Here is how this works in practice.
- Parent ASIN BSR: Reflects total sales across all variations. This is the BSR shoppers see on the main listing page
- Child ASIN BSR: Reflects sales of that specific variation only. Useful for internal analysis
- Best Seller Badge: Awarded based on the parent ASIN BSR, which benefits from combined variation sales
This structure gives products with multiple variations a natural BSR advantage over single-ASIN products. A product offered in five colors will accumulate sales across all five options, pushing the parent BSR lower than any single-variation competitor could achieve alone.
Implications for Sellers
If you are deciding between offering a single SKU and a multi-variation listing, BSR is one more reason to consider variations. The combined sales velocity across variations feeds a stronger parent BSR, which earns better visibility and potentially the Best Seller Badge.
However, adding variations that do not sell well can dilute your listing’s focus without meaningfully improving BSR. Only add variations that have genuine customer demand.
Amazon BSR vs Organic Keyword Ranking
BSR and organic keyword ranking are two fundamentally different metrics, yet they are frequently confused. Understanding the distinction is critical for building the right optimization strategy.
Below is a side-by-side comparison of how these two ranking systems differ.
| Factor | Amazon BSR | Organic Keyword Ranking |
|---|---|---|
| What It Measures | Sales performance vs. category competitors | Relevance and performance for a specific search term |
| Primary Input | Purchase volume and velocity | Keyword relevance, sales history, CTR, conversion rate |
| Scope | Entire product category | Individual keyword or search phrase |
| Update Frequency | Every 1 to 2 hours | Varies (can shift multiple times daily) |
| Visibility to Shoppers | Shown on product detail page | Determines position in search results |
| Direct Revenue Impact | Indirect (social proof) | Direct (determines if shoppers find your product) |
| Seller Control | Limited (driven by sales) | Moderate (listing optimization, PPC, relevance) |
How BSR and Keyword Ranking Interact
While BSR does not directly determine keyword ranking, they share a feedback loop. Strong keyword rankings drive more visibility, which drives more traffic, which drives more sales, which improves BSR. Conversely, a strong BSR with a Best Seller Badge can improve click-through rates in search results, which feeds back into keyword ranking performance.
Think of keyword ranking as the input side (how shoppers find you) and BSR as the output side (how well you are selling relative to your category). Optimizing both creates a virtuous cycle.
10 Proven Ways to Improve Your Amazon BSR
Improving BSR ultimately comes down to increasing your sales velocity. Every tactic below is designed to drive more purchases, faster.
1. Optimize Your Listing for Conversion
Your product listing is your storefront. A poorly optimized listing leaks potential sales at every stage of the buyer journey.
- Write a keyword-rich title that includes your primary search terms naturally
- Use all five bullet points to address customer concerns, highlight benefits, and differentiate from competitors
- Invest in professional product photography with lifestyle images, infographics, and size reference shots
- Create A+ Content (Enhanced Brand Content) to reduce bounce rates and increase time on page
- Fill in all backend search term fields with relevant keywords you did not use in the title or bullets
2. Run Strategic Amazon PPC Campaigns
Sponsored Products, Sponsored Brands, and Sponsored Display campaigns drive incremental sales that directly improve BSR. Every unit sold through PPC counts toward BSR exactly the same as an organic sale.
- Start with automatic campaigns to discover high-performing search terms
- Build exact match campaigns around your top-converting keywords
- Use negative keywords aggressively to eliminate wasted spend
- Monitor ACoS (Advertising Cost of Sale) but prioritize total sales volume during launch phases when BSR improvement is the goal
3. Price Competitively
Pricing is one of the fastest levers for influencing conversion rate and sales velocity. Even small adjustments can meaningfully impact BSR.
- Research competitor pricing for similar products using tools or manual analysis
- Consider temporary promotional pricing to spike sales during a BSR push
- Use coupons and Lightning Deals to create urgency and boost click-through rates from search results
- Avoid pricing so low that you sacrifice profitability. Sustainable BSR requires sustainable margins
4. Drive External Traffic
Amazon’s algorithm increasingly rewards products that bring traffic from outside the platform. External traffic sources can boost both organic ranking and BSR.
- Use Amazon Attribution links to track external traffic and earn Brand Referral Bonus credits
- Run targeted social media ads (Meta, TikTok, Pinterest) pointing to your Amazon listing
- Leverage email lists and content marketing to drive existing audiences to Amazon
- Partner with influencers in your niche through the Amazon Influencer Program
5. Maintain Inventory Levels
Stock-outs are one of the fastest ways to destroy your BSR. When your product is unavailable, sales drop to zero and BSR decays rapidly.
- Set reorder points based on your lead time and average daily sales velocity
- Use Amazon’s inventory planning tools or third-party software to forecast demand
- Build safety stock buffers during peak seasons and promotional periods
- Consider splitting inventory across multiple fulfillment centers to reduce delivery times
6. Earn More Reviews and Higher Ratings
Reviews do not directly factor into BSR calculation, but they heavily influence conversion rates. A product with 500 reviews and a 4.5-star rating will convert significantly better than one with 12 reviews and 3.8 stars.
- Enroll in Amazon’s Vine program for new product launches
- Use the “Request a Review” button in Seller Central consistently
- Include product inserts that encourage feedback (within Amazon’s TOS)
- Address negative reviews and product issues promptly to protect your rating
7. Use Subscribe and Save
If your product is consumable or regularly repurchased, enrolling in Subscribe and Save creates a recurring sales baseline. These repeat orders contribute to BSR consistently without additional advertising spend.
8. Optimize for the Buy Box
If you are competing against other sellers on the same listing, winning the Buy Box is essential. Only Buy Box sales count toward your BSR. Losing the Buy Box means your sales drop and BSR worsens.
- Price competitively among all sellers on the listing
- Maintain strong seller metrics (low defect rate, fast shipping)
- Use FBA, which significantly increases Buy Box win rates
- Monitor Buy Box percentage in your Seller Central business reports
9. Launch Products Strategically
New products on Amazon often receive a brief visibility boost during what sellers call the “honeymoon period” (typically the first 2 to 4 weeks after launch). Maximize this window to establish a strong initial BSR.
- Have inventory in stock and ready before going live
- Start PPC campaigns on launch day
- Drive early external traffic to build momentum
- Stack promotional tactics (coupons, competitive pricing, influencer pushes) during the first two weeks
10. Bundle and Cross-Sell
Creating product bundles that combine complementary items can increase your average order value while giving you a unique ASIN with a fresh BSR opportunity.
- Bundle products that naturally go together (e.g., yoga mat + carrying strap + cleaning spray)
- Cross-sell within your A+ Content by featuring complementary products from your catalog
- Use Amazon’s virtual bundle feature if you are brand registered
How Stock-Outs Destroy Your BSR and How to Recover
Running out of inventory is one of the most damaging events for your Amazon BSR. The impact goes beyond simply losing sales during the out-of-stock period. It triggers a cascading decline that can take weeks to reverse.
What Happens During a Stock-Out
When your product goes out of stock, the following sequence begins.
- Sales drop to zero immediately, and BSR starts decaying within hours
- Amazon suppresses your listing from search results, reducing visibility even after restocking
- Competitors absorb your organic traffic and sales, strengthening their BSR at your expense
- Your keyword rankings deteriorate due to lack of sales velocity
- Advertising campaigns pause automatically when inventory is unavailable
BSR Recovery Timeline
The recovery period depends on how long you were out of stock and how established your product was before the stock-out. Below is a general timeline based on common seller experiences.
| Stock-Out Duration | Typical BSR Recovery Time |
|---|---|
| 1 to 3 days | 3 to 7 days |
| 4 to 7 days | 1 to 3 weeks |
| 1 to 2 weeks | 3 to 6 weeks |
| 3+ weeks | 6 to 12 weeks (sometimes longer) |
Products with a long, strong sales history tend to recover faster than newer products. But even well-established ASINs can struggle to regain their pre-stock-out BSR if competitors captured their market share during the gap.
Using Amazon BSR for Product Research
BSR is not just a performance metric for your own products. It is one of the most valuable data points for evaluating new product opportunities and analyzing competitors.
How to Use BSR in Product Research
When scouting potential products to sell on Amazon, BSR helps you quickly gauge demand, competition, and market viability.
- Validate demand. A product with several competitors holding BSRs under 5,000 in a main category indicates strong, proven demand
- Assess competition intensity. If the top 10 products all have BSRs under 500, breaking into that market requires significant volume
- Spot declining markets. Products where top competitors show consistently worsening BSR trends (tracked over months) may indicate shrinking demand
- Find underserved niches. Products with decent BSR but few competitors, weak listings, or low review counts represent potential opportunities
BSR Red Flags During Product Research
Not every low BSR is a green light. Watch for these warning signs.
- A single product with a very low BSR surrounded by competitors with BSRs over 100,000 suggests a monopoly, not a healthy market
- Products that spike to very low BSR then immediately jump back up likely depend on promotional giveaways, not organic demand
- Extremely seasonal products may show strong BSR for 2 to 3 months and terrible BSR the rest of the year
- Products in oversaturated categories where the top 50 results all have thousands of reviews present high barriers to entry
BSR Analysis Framework for New Products
A practical approach to product evaluation using BSR follows these steps.
- Identify the product’s main category and relevant subcategories
- Check BSR for the top 10 to 20 competitors in the niche
- Use a sales estimation tool to convert those BSRs into approximate daily and monthly sales
- Calculate total estimated market revenue by multiplying estimated unit sales by average selling price
- Evaluate how many competitors share the market and what share is realistic to capture
- Track BSR trends over 30 to 90 days using tools like Keepa or Helium 10 to confirm demand stability
Amazon BSR Across Global Marketplaces
BSR operates independently on each Amazon marketplace. A product’s BSR on Amazon.com (US) has no connection to its BSR on Amazon.co.uk (UK), Amazon.de (Germany), or any other marketplace.
This independence means a product could hold BSR #200 in the US and BSR #15,000 in the UK simultaneously. Each marketplace has its own customer base, competition level, and sales volume, all of which determine BSR independently.
Key differences across marketplaces that affect BSR interpretation include the following.
- Market size. The US marketplace is significantly larger than any other Amazon market. A BSR of 10,000 in the US represents more absolute sales than BSR 10,000 in smaller markets like Canada or Australia
- Category structure. Amazon uses different category trees across marketplaces. A product might sit in different categories depending on the marketplace
- Competition density. European and Asian marketplaces often have less competition per category, making lower BSRs easier to achieve
- Seasonal patterns. Peak shopping periods differ by region (e.g., Diwali in India, Singles Day impact in some Asian markets)
If you sell across multiple Amazon marketplaces, track BSR separately for each and avoid comparing numbers across regions.
Frequently Asked Questions
What does BSR mean on Amazon?
BSR stands for Best Seller Rank. It is a number Amazon assigns to every product that has made at least one sale, indicating how well it sells compared to other products in the same category. A BSR of #1 means it is the top-selling product in that category.
How is Amazon BSR calculated?
Amazon uses a proprietary algorithm that weighs recent sales velocity most heavily, followed by historical sales consistency. The exact formula is not public, but it is updated every 1 to 2 hours and reflects performance relative to all other products in the same category.
What is a good BSR on Amazon?
A “good” BSR depends entirely on the category. In a large category like Books with over 60 million listings, a BSR of 20,000 is excellent. In a smaller category like Musical Instruments, BSR 2,000 would reflect similar relative performance. Generally, being in the top 0.5% of your category indicates strong sales.
Does Amazon BSR affect organic ranking?
BSR does not directly affect organic keyword ranking. However, both are influenced by the same underlying factor: sales velocity. Products that sell well earn better BSR and tend to rank higher for relevant keywords because Amazon’s search algorithm also values sales performance.
How often does Amazon BSR update?
Amazon updates BSR every 1 to 2 hours. This frequent recalculation is why BSR can change dramatically within a single day based on sales patterns.
Does PPC (advertising) affect BSR?
Yes. Every sale generated through Amazon PPC counts toward BSR exactly the same as an organic sale. Running effective advertising campaigns is one of the fastest ways to improve BSR.
What is the difference between BSR and the Best Seller Badge?
BSR is the numerical ranking assigned to every product with sales history. The Best Seller Badge is an orange label displayed only on the product that currently holds the #1 BSR in a specific category or subcategory. All products have BSR, but only the top-ranked product earns the badge.
Is Amazon BSR the same across all countries?
No. BSR is calculated independently for each Amazon marketplace. Your product’s BSR on Amazon.com (US) is completely separate from its BSR on Amazon.co.uk (UK), Amazon.de (Germany), or any other regional marketplace. The rankings reflect sales performance within that specific marketplace only.