
Optimizing your Amazon conversion rate is the foundation of success on the platform. Amazon conversion rate measures the percentage of visitors who purchase your product after viewing your listing.
Amazon officially calls this metric Unit Session Percentage in Seller Central, and it’s calculated by dividing the number of orders by the total number of sessions (unique visitors within a 24-hour period).
Conversion Rate (Unit Session Percentage) = (Total Orders ÷ Total Sessions) × 100
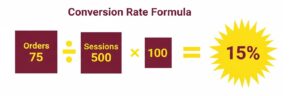
For example, if your product listing receives 500 sessions in a month and generates 75 orders, your conversion rate would be 15%. This means that for every 100 people who view your listing, 15 make a purchase.
This comprehensive guide reveals everything you need to know about conversion rates, from the latest 2025 benchmarks to proven optimization strategies that actually move the needle.
Why Amazon Conversion Rates Are Significantly Higher
Amazon’s marketplace consistently delivers conversion rates that dwarf traditional e-commerce websites. While a typical Shopify store celebrates a 2-3% conversion rate, Amazon listings routinely convert at 10-15% or higher. Several unique factors drive this dramatic difference.
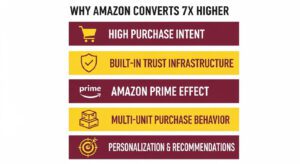
1. High Purchase Intent From the Start
Shoppers on Amazon arrive with buying intent already formed. They’re not casually browsing, they’re actively searching for products to purchase, often with credit card information already saved and ready to use. This creates a fundamentally different user journey compared to discovery-based shopping on social media or search engines.
2. Amazon’s Built-in Trust Infrastructure
Amazon has spent decades building consumer trust through consistent delivery on promises like fast shipping, easy returns, and reliable customer service with FBA. For seller-fulfilled (FBM) products, the A-to-z Guarantee removes purchase anxiety, while Amazon’s dispute resolution process protects buyers from potential problems.
This institutional trust transfers to third-party sellers on the platform. Even if customers have never heard of your brand, they trust that Amazon will protect them if something goes wrong.
3. The Amazon Prime Effect
Amazon Prime membership fundamentally transforms shopping behavior. Prime members don’t just get free shipping, they experience a psychological shift where Amazon becomes their default buying option. According to recent data, Prime members convert at an astonishing 74% compared to just 13% for non-Prime shoppers.
When you offer FBA (Fulfillment by Amazon), your products become Prime-eligible, instantly tapping into this high-converting customer segment. The Prime badge is a conversion accelerator that can triple your conversion rate.
4. Multi-Unit Purchase Behavior
Amazon’s conversion rate calculation includes a unique advantage: it counts units sold, not just orders placed. If a customer buys three units of your product in a single session, that counts as three conversions, not one. This is particularly powerful for consumable products, household goods, and items frequently purchased in bulk.
5. Personalization and Recommendation
Amazon’s algorithm continuously learns customer preferences and serves personalized product recommendations. The “Frequently Bought Together” and “Customers Who Bought This Also Bought” features create additional conversion opportunities by reducing friction in the buying process.
This sophisticated recommendation system helps customers discover complementary products they actually want, increasing both conversion rates and average order values simultaneously.
Amazon vs. E-commerce Conversion Rate
The performance gap between Amazon and traditional e-commerce platforms is striking. Understanding these benchmarks helps you set realistic expectations and identify when your listings underperform.
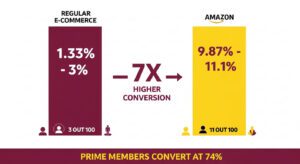
Average conversion rates hover around 1.33% to 3%. A well-optimized Shopify store with strong traffic might reach 4%, which would be considered excellent.
Average conversion rates range from 9.87% to 11.1% across all product categories as of 2025. This represents approximately 7x higher conversion efficiency than non-Amazon platforms.
Products enrolled in FBA and displaying the Prime badge see conversion rates between 15-25% on average, with top performers exceeding 30%.
Prime members convert at approximately 74% when shopping for Prime-eligible products, a conversion rate 22 times higher than typical online retailers.
2025-26 Amazon Conversion Rate Benchmarks
Determining whether your conversion rate is “good” requires context. A 12% conversion rate might be exceptional for a $200 electronics product but disappointing for a $15 kitchen gadget. Category, price point, competition level, and product maturity all influence what constitutes strong performance.
1. General Amazon Conversion Rate Benchmarks
Based on 2025 data from multiple sources including Ad Badger, Perpetua Labs, and Amazon’s own advertising console:
- Below 5%: Indicates significant issues with product-market fit, listing quality, pricing, or targeting. Immediate optimization needed.
- 5-8%: Below average. Your listing converts visitors, but competitors are likely outperforming you.
- 8-12%: Average performance. You’re competitive but have room for improvement.
- 13-15%: Above average. Your listing performs better than most competitors in your space.
- 15-20%: Excellent performance. You’ve achieved strong product-market fit and listing optimization.
- 20-30%+: Outstanding. Typically seen with consumables, low-priced impulse buys, or perfectly optimized listings with strong brand loyalty.
2. Conversion Rate Benchmarks by Product Category
Different product categories exhibit vastly different conversion patterns. Here’s what to expect:
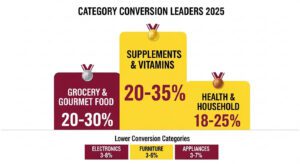
High Conversion Categories:
- Grocery and gourmet food: 20-30%
- Health and household: 18-25%
- Beauty and personal care: 15-25%
- Supplements and vitamins: 20-35%
- Pet supplies (consumables): 18-28%
These categories benefit from frequent repurchase behavior, lower price points, and strong brand loyalty. Customers often know exactly what they want before searching, leading to quick purchase decisions.
Medium Conversion Categories (8-15%):
- Home and kitchen: 10-15%
- Sports and outdoors: 9-14%
- Toys and games: 10-15%
- Office products: 9-13%
- Automotive: 8-12%
Lower Conversion Categories (3-10%):
- Electronics: 3-8%
- Computers and accessories: 4-9%
- Appliances (large): 3-7%
- Furniture: 3-6%
- Fashion (premium): 4-8%
High-consideration purchases with significant price points naturally convert lower because customers conduct extensive research, compare multiple options, and often take days or weeks to decide. A 6% conversion rate for a $300 laptop might be excellent, while the same rate for a $12 phone case would signal problems.
How Price Point Affects Conversion Expectations
Product prices directly influence conversion rate on Amazon. According to 2025 data from SellerMetrics, Ad Badger, and Saras Analytics, conversion rates decline as prices increase. Lower-priced items trigger impulse purchases while higher-ticket products require extended research periods.
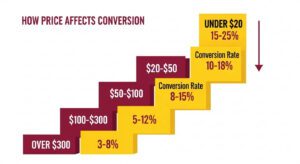
Below are the average conversion rates at different price points
- Under $20: 15-25% conversion rate
- $20-$50: 10-18% conversion rate
- $50-$100: 8-15% conversion rate
- $100-$300: 5-12% conversion rate
- Over $300: 3-8% conversion rate
How Conversion Rate Directly Impacts Your Amazon Rankings and Sales
Conversion rate is a ranking signal that Amazon’s A9 algorithm heavily weighs when determining which products to show in search results. Understanding this relationship is important for long-term success.
1. Conversion Rate as a Ranking Factor
Amazon’s primary business goal is selling products efficiently. The algorithm rewards listings that convert visitors into buyers because this increase Amazon’s revenue per click. When your product consistently converts better than competitors for the same keywords, Amazon responds by showing your listing to more shoppers.
This creates a powerful flywheel effect: better conversion → higher rankings → more visibility → more sales → even higher rankings. Conversely, poor conversion rates trigger a downward spiral where Amazon progressively reduces your organic visibility.
2. The Sales Velocity
Sales velocity is how many units you sell within a specific timeframe. A listing generating 100 sales from 1,000 sessions (10% conversion) demonstrates stronger market fit than one generating 100 sales from 5,000 sessions (2% conversion).
Amazon interprets high sales velocity as a signal that your product satisfies customer needs effectively, triggering improved rankings that further accelerate sales growth. This is why new product launches often focus intensely on conversion optimization during the critical first 60-90 days.
3. Amazon Advertising Campaigns
Every PPC campaign’s success depends on conversion rate. When you pay $1.50 for an ad click and convert at 5%, you need $30 in sales to generate one order. When you convert at 15%, you only need $10 in sales for that same order.
Higher conversion rates directly improve your ACOS, ROAS, and TACoS. A listing converting at 15% can sustain profitable advertising at keyword costs that would bankrupt a 5% converting competitor.
Where to Find Your Amazon Conversion Rate in Seller Central
Amazon provides multiple tools for tracking conversion rate, each offering different insights into your performance. Here is how you can find your conversion rate on Amazon.
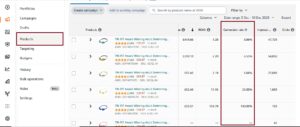
1. Business Reports
This is your primary source for organic conversion rate data:
- Go to Reports → Business Reports
- Select Detail Page Sales and Traffic by Parent Item or by Child Item
- Look for the Unit Session Percentage column
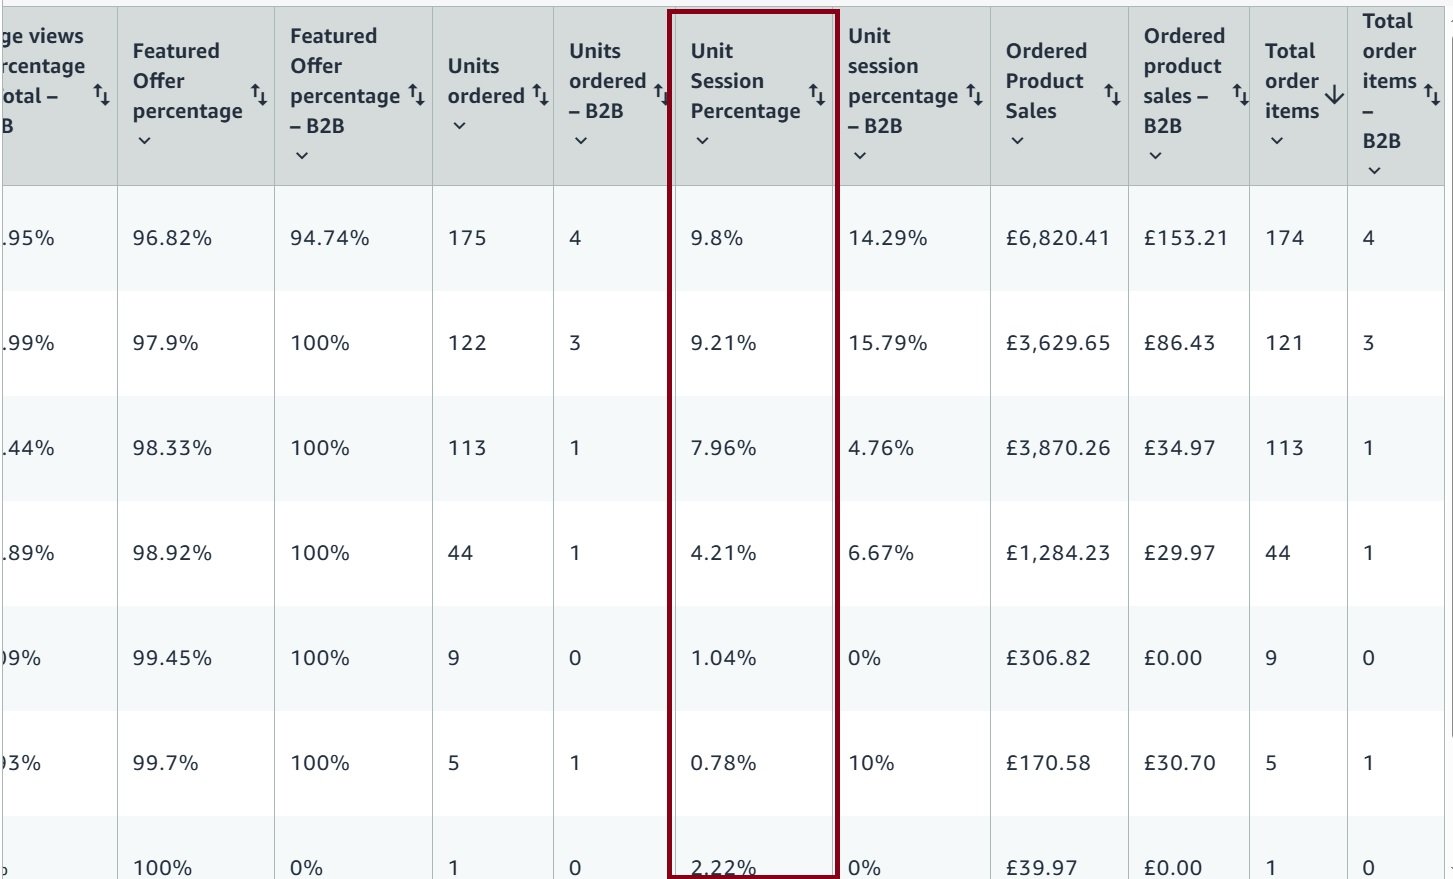
This report shows your conversion rate over your selected date range (last 7 days, 30 days, 90 days, etc.). You can view data at the parent ASIN level to see overall performance or drill down to individual variations to identify which colors, sizes, or configurations convert best.
2. Amazon Advertising Console
For advertising-specific conversion data:
- Go to Advertising → Campaign Manager
- Click Products in the left menu
- Select Columns and enable Conversion Rate
This view shows which advertised ASINs turn ad clicks into orders. The conversion rate here specifically measures paid traffic performance, helping you identify which products justify continued ad investment and which need listing optimization before additional advertising makes sense.
You can also download Sponsored Products Search Term Reports to calculate conversion rate by individual keyword:
- Conversion Rate = Orders ÷ Clicks × 100
This data reveals which search terms attract high-intent buyers versus which drive curious but non-converting traffic.
3. Brand Analytics: Search Query Performance Report
For Brand Registry members, this advanced report provides individual keyword like impressions clicks, purchases that you can use to calculate average conversion rate.
- Access Brands → Brand Analytics → Amazon Search Query Performance
- Calculate conversion rate using: Search Funnel Purchases ÷ Search Funnel Clicks
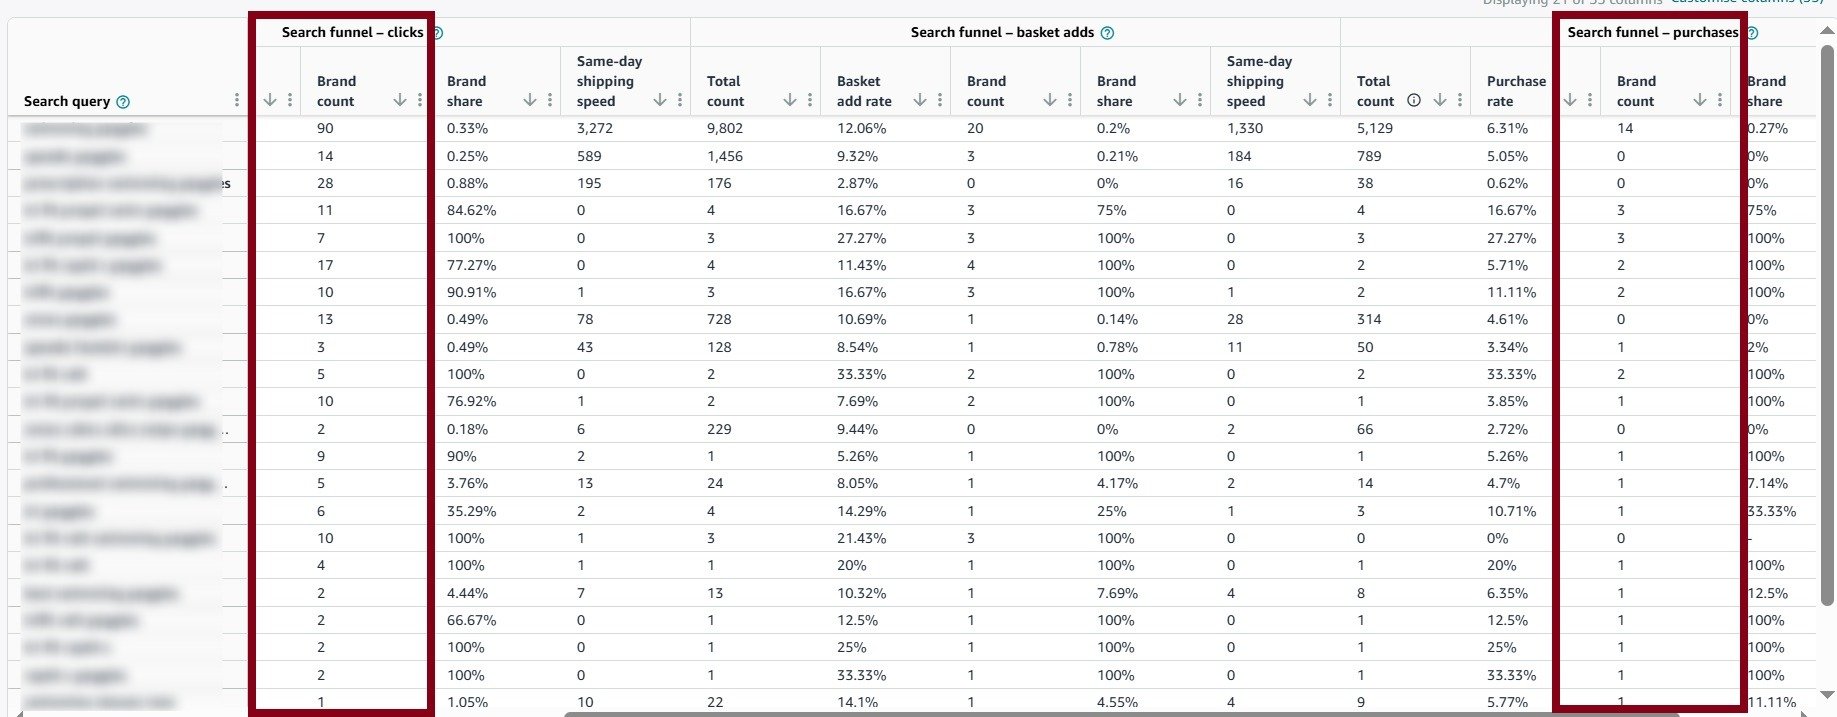
This shows conversion performance by specific search terms across your entire brand, revealing which keywords naturally convert better and deserve more aggressive bidding in PPC campaigns.
Amazon Advertising Conversion Rate
Your advertising conversion rate measures a specific subset of your overall traffic: the percentage of people who click your paid ads and then complete a purchase. This metric requires separate tracking and optimization from organic conversion rate.
1. The PPC Conversion Rate Formula
Ad Conversion Rate = (Orders from Ads ÷ Clicks on Ads) × 100
If your Sponsored Product campaign generates 200 clicks and produces 24 orders, your ad conversion rate is 12%.
2025 Amazon Advertising Conversion Rate Benchmarks
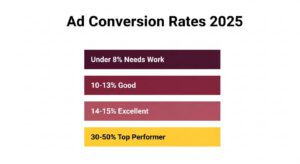
According to the latest data from Ad Badger, Saras Analytics, and Perpetua Labs:
- Average Ad Conversion Rate: 9.5-11.1%
- Below Average: Under 8%
- Good Performance: 10-13%
- Excellent Performance: 14-15%+
- Top Performers (seasonal/consumables): 30-50%
These rates are significantly higher than typical Google Ads (2-3%) or Facebook Ads (1-2%) because Amazon traffic arrives with much stronger purchase intent.
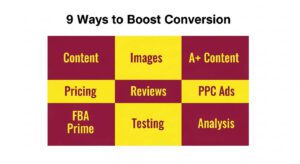
Comprehensive Strategies to Improve Your Amazon Conversion Rate
Optimization conversion rate requires a systematic approach addressing every element that influences purchase decisions. The following strategies represent proven methods for driving measurable conversion improvements.
1. Listing Content Optimization
Your product listing is a salesperson that never sleeps. Every element must work together to guide visitors toward the purchase decision.
Product Title Optimization (Post-2025 Rules)
Craft titles that balance compliance with conversion effectiveness:
Format: Brand + Product Type + Key Defining Features + Size/Color/Quantity
Example: “SoundPro True Wireless Earbuds, Bluetooth 5.3 with Active Noise Cancelling, 32Hr Battery, IPX7 Waterproof for Sports, Black”
The optimized version:
- Stays under 200 characters
- Leads with brand name for recognition
- Clearly identifies product type immediately
- Lists most important features (Bluetooth version, ANC, battery life, waterproof rating)
- Includes variation (color) for filtering
- Removes promotional fluff that violates policy
Place your primary keyword within the first 80 characters because this is what displays in mobile search results and truncated desktop views. If mobile shoppers can’t understand what you’re selling from the truncated title, they won’t click, meaning you never get the chance to convert them.
Bullet Points That Actually Sell
Most sellers waste bullet points listing features without connecting them to benefits. Conversion-optimized bullets follow a problem-solution-outcome structure:
Weak Bullet: “32-hour battery life with USB-C fast charging”
Strong Bullet: “Never Run Out Mid-Workout: 32-hour battery delivers full week of gym sessions on one charge, while USB-C fast charging provides 2 hours of playback from just 10 minutes plugged in”. Here is bullet point optimization checklist:
- First bullet addresses the #1 customer question or pain point
- Each subsequent bullet covers a distinct benefit/feature
- Include specific numbers and measurements instead of vague claims
- Address objections preemptively (e.g., “Works with iPhone and Android”)
- Naturally incorporate secondary keywords
Product Description
While many shoppers never scroll to the description section, those who do are often in the final decision stage. Your description should build emotional connection: Instead of “Made with high-quality materials,” write “Constructed from aerospace-grade aluminum and reinforced silicone, the same materials used in professional mountain climbing equipment, ensuring your purchase lasts years instead of months.”
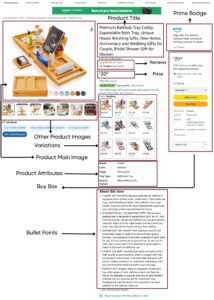
2. Visual Content That Converts
Images drive more conversion impact than any other single element. Amazon allows up to 9 images so use all of them strategically.
Main Image Optimization
Your main image determines whether shoppers click from search results. It must:
- Fill 85% of the frame with your actual product
- Use pure white background (RGB 255, 255, 255) to meet Amazon requirements
- Show the product in use position if that’s more recognizable than static
- Display at minimum 1600×1600 pixels to enable zoom functionality
- Be professionally lit with no harsh shadows or color distortion
Even slight quality improvements to main images can drive 15-30% conversion rate increases. Test multiple main image variations using Amazon’s Manage Your Experiments tool to identify the highest-converting option.
Secondary Images Optimization
Your 2nd through 9th images should follow a conversion-focused narrative:
- Image 2: Product in use by your target customer (lifestyle shot)
- Image 3: Key feature callout infographic highlighting main benefit
- Image 4: Size/scale comparison (next to common object or in hand)
- Image 5: All included components/accessories laid out
- Image 6: Feature comparison infographic (vs. competitor approach)
- Image 7: Additional angle or color variation
- Image 8: Quality/materials close-up
- Image 9: Warranty/guarantee/certification badges
This sequence takes shoppers through a complete decision journey: seeing the product, understanding how they’ll use it, learning key benefits, evaluating size and contents, comparing alternatives, and final trust-building.
Video Content Integration
Product videos deliver some of the highest conversion rate improvements available. Listings with videos convert 9-15% higher than those without.
Effective Product Videos:
- Keep to 15-30 seconds for attention retention
- Show product immediately (first 3 seconds)
- Demonstrate key benefit visually (don’t rely on audio as 80% watch muted)
- Include text overlays explaining features
- Show product in real-world use not just studio shots
- End with clear benefit statement or call-to-action
User-generated content videos (customers showing your product in authentic settings) convert 23% higher than professional studio videos according to 2025 data, though professional quality still matters for trust.
3. A+ Content
If you’re Brand Registered, A+ Content (Enhanced Brand Content) provides additional conversion leverage that standard sellers can’t access. Here are some of the high-converting A+ modules that you should use.
Comparison Chart Module: Shows your product line side-by-side, making it easy for customers to choose the right variation. Reduces decision paralysis and improves conversion rate by 8-12% on average.
Lifestyle Image Gallery: Displays your product in aspirational use cases, building emotional connection. Particularly effective for Home, Beauty, and Apparel categories.
Q&A Module: Addresses common questions directly in A+ Content, reducing abandonment from unanswered concerns.
Brand Story Module: Builds trust and connection, especially important for premium-priced products where customers want to understand who they’re buying from.
Technical Specifications Table: Provides detailed specs in scannable format, crucial for Electronics and Tools categories.
4. Pricing Strategy for Conversion
Price is simultaneously one of the most important conversion factors and one of the hardest to optimize. You must balance competitiveness with profitability.
Monitor your top 5 competitors’ pricing daily using using the strategies below and change your price accordingly.
- Keepa or CamelCamelCamel for price history tracking
- Helium 10’s Market Tracker for real-time competitive monitoring
- Manual review of search results in your category
Promotions and Deals
Well-timed promotions reduce buying hesitation and push faster purchase decisions without permanently lowering perceived value.
- Small clippable coupons (5–10%) consistently lift conversion
- Lightning Deals generate sharp, short-term conversion spikes
- Subscribe & Save discounts work for consumables by improving initial conversion and repeat sales.
5. Reviews and Social Proof Optimization
Reviews directly correlate with conversion rate. Products with 4.0+ stars convert significantly better than those below 4.0, and review count matters almost as much as rating.
Review Acquisition Strategy:
- Use Amazon Vine Program for new products, Vine generates 10-30 early reviews quickly (typically within 30 days).
- Use Amazon’s automated review request feature for every order. This compliant method generates 5-10% review rate typically.
- The best review strategy is genuinely satisfying customers with good quality product.
6. Amazon PPC Campaign Optimization
Your advertising campaigns should feed high-converting traffic to optimized listings, creating a profit-multiplying effect. Download Search Term Reports monthly and calculate conversion rate for each keyword:
- Identify keywords converting above 15% → Increase bids to capture more traffic
- Find keywords converting 8-15% → Maintain current strategy
- Isolate keywords converting below 5% → Reduce bids or add as negative keywords
This granular optimization ensures you’re only paying for traffic that actually converts.
Low-converting keywords destroy PPC profitability. Add negative keywords for:
- Broad non-intent terms (e.g., “free,” “cheap,” “used”)
- Competitor brand names (unless you legitimately compete)
- Wrong product types (e.g., “laptop case” when you sell tablet cases)
- Research-only terms (e.g., “best [product] 2025” often converts poorly)
7. Fulfillment Method and Prime Eligibility
Enrollment in FBA (Fulfillment by Amazon) remains one of the single largest conversion rate levers available to sellers. Non-Prime products convert at 10-13% on average, while Prime-eligible products jump to 18-25%. When Prime members view Prime products, conversion rates skyrocket to 74%.
The Prime badge signals fast and free shipping, easy returns through Amazon, reliable delivery backed by Amazon’s logistics reputation. Even accounting for FBA fees, the 40-100% conversion rate increase usually generates significantly higher net profit through increased sales volume and reduced advertising costs, since higher conversion means lower ACoS.
8. A/B Testing for Continuous Improvement
Amazon’s Manage Your Experiments tool allows you to test listing variations and measure which version converts better. Focus your testing efforts on the elements that drive the biggest conversion impact: main images, titles, and A+ Content layouts.
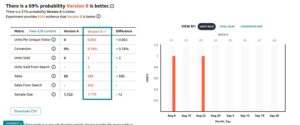
Test main image variations, title, A+ Content and more to identify the version with high conversion rate. Here are the best testing practices.
- Run tests for minimum 6-8 weeks to gather statistically significant data
- Test only one element at a time to isolate impact
- Require at minimum 50 conversions per variation before concluding
Sellers who consistently A/B test improve conversion rates 15-25% annually through compounding small wins. Implement winning variations permanently, then move on to test the next element in your optimization queue.
9. Competitor Analysis for Conversion Insights
Analyze your top 5-10 competitors to understand what converts in your category without spending money on testing. Use Helium 10, Jungle Scout, or manual review to identify patterns. Here are the key analysis points:
- Review customer complaints in competitor reviews to find product gaps you can solve
- Check their image sequence to see which features get visual priority
- Compare pricing relative to features and reviews to find your positioning
- Identify common A+ Content modules that work in your category
- Look for missing content (videos, comparison charts, detailed specs) you can add
If competitors’ reviews repeatedly mention the same problem and your product solves it, emphasize that solution in your title, first bullet, and main image. This immediately differentiates you and captures frustrated buyers switching from competitors.
Frequently Asked Questions
What is considered a good conversion rate on Amazon?
Generally, 10-15% is average across the platform, while 15-20% represents above-average performance. Products under $20 should achieve 15-25%, while items over $100 may perform well at 5-10%.
How do I calculate my Amazon conversion rate?
Divide total orders by total sessions, then multiply by 100. Amazon displays this as “Unit Session Percentage” in Business Reports under Detail Page Sales and Traffic.
Why is my Amazon conversion rate dropping?
Common causes include new competitors with better pricing, accumulation of negative reviews, price increases without value additions, demand changes, loss of Buy Box, or declining product quality. Check when the decline started, then investigate what changed.
What’s the difference between Amazon conversion rate and advertising conversion rate?
Amazon conversion rate measures all traffic (organic and paid). Advertising conversion rate specifically measures only PPC campaign traffic. Your ad conversion may differ from organic if keyword targeting attracts different buyer intent.
How quickly can I improve my conversion rate?
Simple fixes like price adjustments or better images can improve conversion within days. Substantial changes like accumulating reviews or developing A+ Content take weeks to months. Most sellers see 3-5% improvements within 30-60 days of systematic optimization.
What conversion rate should I target for new products?
New products without reviews typically convert 40-60% lower than established products. If your category average is 15%, expect 6-9% as a new listing. Focus on quickly acquiring 15-25 reviews to reach category-average rates.
Should I prioritize traffic or conversion rate?
Conversion rate typically delivers faster ROI improvements. A 20% conversion increase immediately boosts sales 20% without additional ad spend. Once conversion is optimized (above category average), then invest in traffic growth.