£340K from a cold start, with 70% of sales organic by month nine.
This Home and Kitchen brand launched into a saturated Amazon UK category with zero reviews, zero ranking and a £5,000 to £8,000 monthly budget. The listing was rebuilt before a pound went into ads, then campaigns were structured to buy organic rank rather than rent placements. Revenue closed at £340,214 with TACoS at 5.5%.
The category was crowded. The listing was the bigger problem.
The brand launched in December 2023 with one hero SKU, a multi-use kitchen organiser at £24.99. No reviews, no organic ranking, no brand recognition, and a page one held by incumbents sitting on thousands of verified reviews.
The audit found the real constraint before advertising was even discussed. The main image was clicking 41% below the category benchmark, listing quality scored 52 out of 100, and only 31% of the backend search terms were actually indexed. Ads on that foundation would have paid Amazon for clicks the listing could not convert, and a low conversion rate pushes the cost per click up rather than down.
So the listing was rebuilt first, and the ads that followed were structured to buy organic position rather than ad-attributed revenue.
| Marketplace | Amazon UK, FBA and FBM hybrid |
|---|---|
| Category | Home and Kitchen Accessories |
| Engagement | PPC and listing optimisation, 9 months |
| Monthly ad budget | £5,000 to £8,000 |
| Verified reviews | 0 at launch |
| Main image CTR | 41% below category benchmark |
| Listing quality score | 52 out of 100 |
| Backend indexation | 31% of tracked terms |
| Organic visibility | 4% of tracked keywords ranking |
Each one made the next one cheaper.
The keyword map came first, so the listing and the campaigns were written against the same terms. Better images pulled the cost per click down. Reviews lifted conversion. Organic rank then took over the placements the ads had been renting.
Keyword architecture before anything went live
Helium 10 Cerebro and Brand Analytics data built the keyword map: three primary terms, fourteen secondary and more than eighty long-tail phrases, each sorted by purchase intent rather than search volume. Every later decision, from title structure to bid ceilings, was made against that map.
The listing rewritten from title to backend
The title was rebuilt around primary and secondary intent instead of stuffed with volume terms. Five benefit-led bullets were written for both the search thumbnail and the product page. A+ Content carried a comparison module to answer the objections that were sending buyers back to search, and backend search terms were pushed to the full 249-byte limit.
A 59 point swing on main image click-through
The main image was the highest leverage element on the listing and it was losing. New images were briefed for thumbnail size specifically, not for a product page viewed at full width. Click-through went from 41% below the category benchmark to 18% above it, which lowered the effective cost per click across every campaign at once.
Campaigns structured to buy rank, not clicks
ACoS was allowed to run high in the opening months on purpose. The job in that window was sales velocity on the primary terms, because velocity is what moves organic position. Once page one was held, budget shifted to exact-match winners and the account started paying for itself.
| Listing quality score | 52 out of 100 | →94 out of 100 |
|---|---|---|
| Verified reviews | 0 | →412 |
| Primary keyword rank | Page 6 | →Page 1, position 3 |
| Star rating | 4.1 stars | →4.6 stars |
| Main image CTR | 41% below benchmark | →18% above benchmark |
| Backend indexation | 31% | →98% |
| Category BSR | #84,200 | →#1,840 |
| Session conversion rate | 8.4% | →21.3% |
Three campaign types, three jobs, one keyword map.
Sponsored Products carried conversion. Sponsored Brands protected the name once it had value worth protecting. Sponsored Display sat on competitor detail pages and pulled browsers across. Nothing launched until the term it targeted had a rank goal attached to it.
| SP | Sponsored ProductsCore revenue engine | Broad and exact campaigns across the three primary keywords, with auto campaigns held at lower bids to harvest new ASIN and search term targets. Search term reports were read weekly, winners promoted into exact match and unprofitable terms negated. ACoS ran deliberately high in months one to three to build the sales velocity that moves organic position. |
|---|---|---|
| SB | Sponsored BrandsVisibility and brand defence | Sponsored Brands Video launched in phase three on the top five exact-match keywords, once organic rank had broken page one and the review count was high enough to convert the traffic. A defensive brand-name exact campaign was added at the same point to keep competitors off the branded search the listing had earned. |
| SD | Sponsored DisplayCompetitor interception | Deployed from phase two against competitor ASINs, catching shoppers on rival detail pages and moving them to the rebuilt listing. This added touchpoints across the decision window and accelerated the review velocity that pushed conversion above category norms, which is what made the organic flywheel self-sustaining by month five. |
| 01 | Research and foundationJanuary to February | Keyword architecture built, listing rewritten end to end, A+ Content produced and backend fields filled to the byte limit. New main images briefed and delivered before the first campaign went live. |
|---|---|---|
| 02 | Launch and scaleMarch to June | Full SP, SB Video and SD coverage. Organic rank broke page one on the primary keyword in week nine. TACoS fell as organic sessions started carrying order volume without incremental spend, and the review count crossed 180 by the end of June. |
| 03 | Harvest and defendJuly to September | Budget concentrated on exact-match winners. An August Lightning Deal lifted BSR and organic placement further. ACoS reached 18.2% and TACoS collapsed to 5.5% as organic overtook paid to make up 70% of all sales. |
£44,272 in total ad spend. 3.73× average ROAS. 14,408 units sold. TACoS down from 39.2% to 5.5%, and page one position three on the primary keyword at close.
Ad spend fell while revenue climbed.
Every month the account needed a smaller share of revenue to hold its position. That gap between rising sales and falling spend is the only real proof that advertising is building an asset instead of renting one. Of the £340,214 total, £165,180 was ad-attributed. The rest arrived without paying for the click.
| Month | Total sales | Ad spend | ACoS | TACoS | Units | Organic share |
|---|---|---|---|---|---|---|
| January 2024 | £12,400 | £4,857 | 40.8% | 39.2% | 525 | 4% |
| February 2024 | £19,200 | £6,047 | 36.2% | 31.5% | 813 | 13% |
| March 2024 | £27,400 | £6,772 | 32.1% | 24.7% | 1,160 | 23% |
| April 2024 | £34,800 | £6,325 | 28.4% | 18.2% | 1,474 | 36% |
| May 2024 | £40,200 | £5,393 | 25.8% | 13.4% | 1,702 | 48% |
| June 2024 | £42,600 | £4,311 | 23.0% | 10.1% | 1,804 | 56% |
| July 2024 | £47,400 | £3,753 | 21.4% | 7.9% | 2,007 | 63% |
| August 2024 | £57,600 | £3,613 | 19.6% | 6.3% | 2,439 | 68% |
| September 2024 | £58,614 | £3,200 | 18.2% | 5.5% | 2,484 | 70% |
| Total and average | £340,214 | £44,272 | 26.8% | 13.0% | 14,408 | 70% |
Revenue up, dependency down.
Four numbers moved in the same direction at once, which only happens when the listing and the campaigns are treated as one system instead of two retainers running in parallel.
£340,214 across January to September 2024.
Nine monthsTotal ad cost as a share of total revenue.
From 39.2%On a 3.73× average return across the period.
From 40.8%Of 13,730 total orders, placed without a paid click.
51.4% of all orders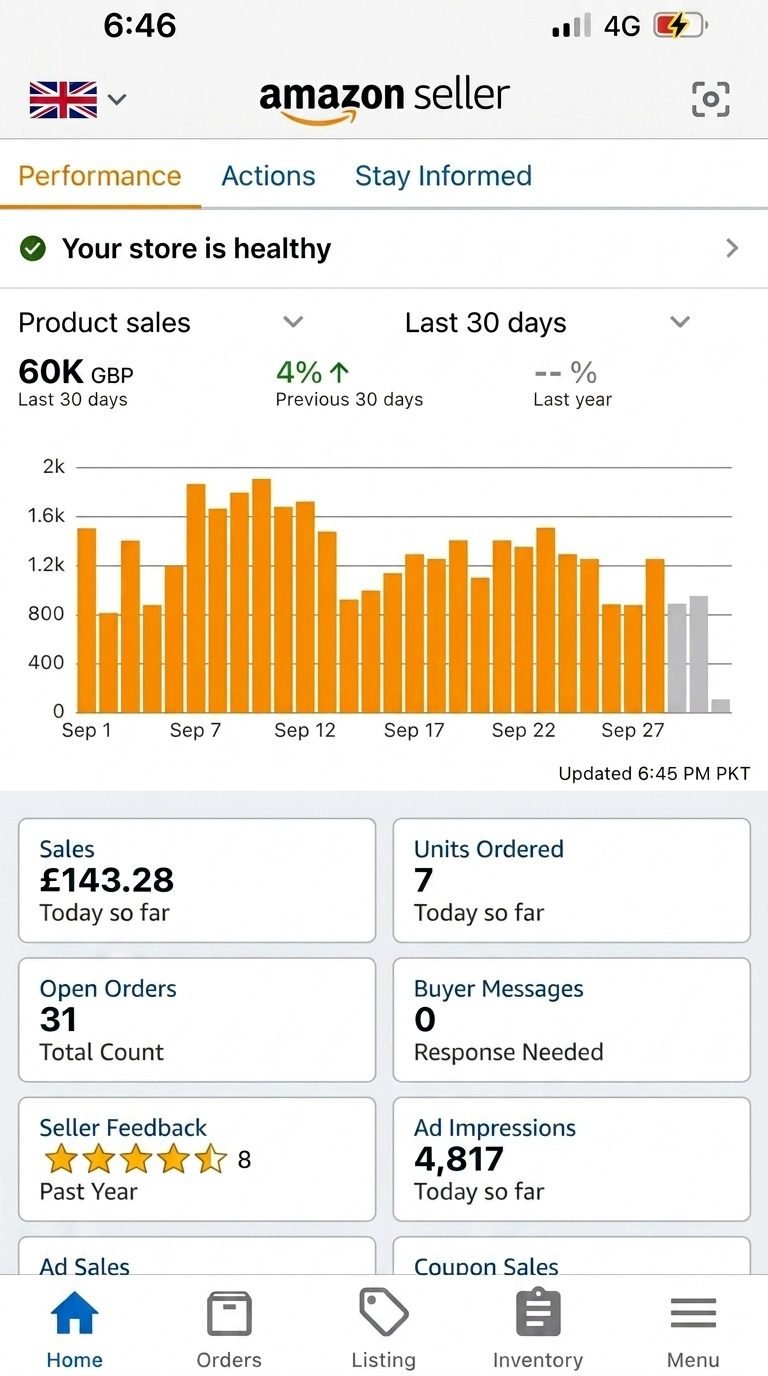
Organic overtook paid in month five.
The usual launch playbook is to run aggressive PPC and hope organic follows. Here the organic outcome was designed into the campaign structure from the first week: which terms to win, in what order, and what a placement was worth holding.
The TACoS drop from 39.2% to 5.5% was not the result of cutting spend. Spend did fall, but only after organic rank was doing the work the ads used to pay for. By September the brand was spending less every month and selling more every week.
That is the difference between buying rank and renting placements.
What sellers usually ask next.
Was this a PPC-only engagement?
No. PPC was one half of it. The listing was rebuilt first, covering title, bullets, backend search terms, A+ Content and new main images. Running ads on the original listing would have meant paying category-level click prices for a page converting at 8.4%.
Why let ACoS run high at the start?
Because organic rank responds to sales velocity, not to efficiency. In months one to three the goal was volume on three primary keywords. Once page one was held, the same revenue needed far less spend, which is exactly what the monthly table shows.
Can a new brand repeat this in another UK category?
The sequence transfers, the numbers depend on category demand, margin and how entrenched the incumbents are. What holds is the order of work: keyword map, listing, images, then paid campaigns built around the rank you want to own.
Can Ecom Brainly do the listing work only?
Yes. Some sellers want the keyword architecture, listing rebuild and campaign blueprint while their own team runs the day to day. That works, as long as the listing work is not skipped in favour of going straight to ads.
Want to see where your account is losing money?
Book a free 30-minute call. We will look at your campaigns, listings, keyword coverage and account structure, then give you clear next steps.
30 minutes · No commitment · Amazon only since 2017