Amazon Product Opportunity Explorer: The 2026 Guide for Sellers
When you are researching a product to launch on Amazon, you want to be sure you are reading demand and competition data straight from Amazon itself, not estimates from a third-party tool. Amazon Product Opportunity Explorer (POE) is the closest you get to that.

When you are researching a product to launch on Amazon, you want to be sure you are reading demand and competition data straight from Amazon itself, not estimates from a third-party tool. Amazon Product Opportunity Explorer (POE) is the closest you get to that.
Product Opportunity Explorer is a research tool inside Amazon Brand Analytics that helps sellers evaluate product demand and discover new opportunities to launch, expand, or optimize. You access it at Brands → Growth → Product Opportunity Explorer inside Seller Central.
What POE Offers
Here is what the tool gives you inside any niche:
- Search by category and subcategory to browse niches Amazon has indexed by customer search behavior
- Search by keyword or ASIN to check the niche around a product idea you already have
- Niche-level analysis showing demand, competition, and customer experience metrics in one view
- Top clicked products with launch date, price, ratings, BSR, and seller count for every leading ASIN
- Search terms inside the niche with volume, growth, click share, and conversion rate
- Customer Review Insights showing positive and negative review topics as percentages of mentions
- Returns data showing return reasons grouped by topic
The five tabs inside any niche are: Insights and trends, Products, Search terms, Customer Review Insights, and Returns.
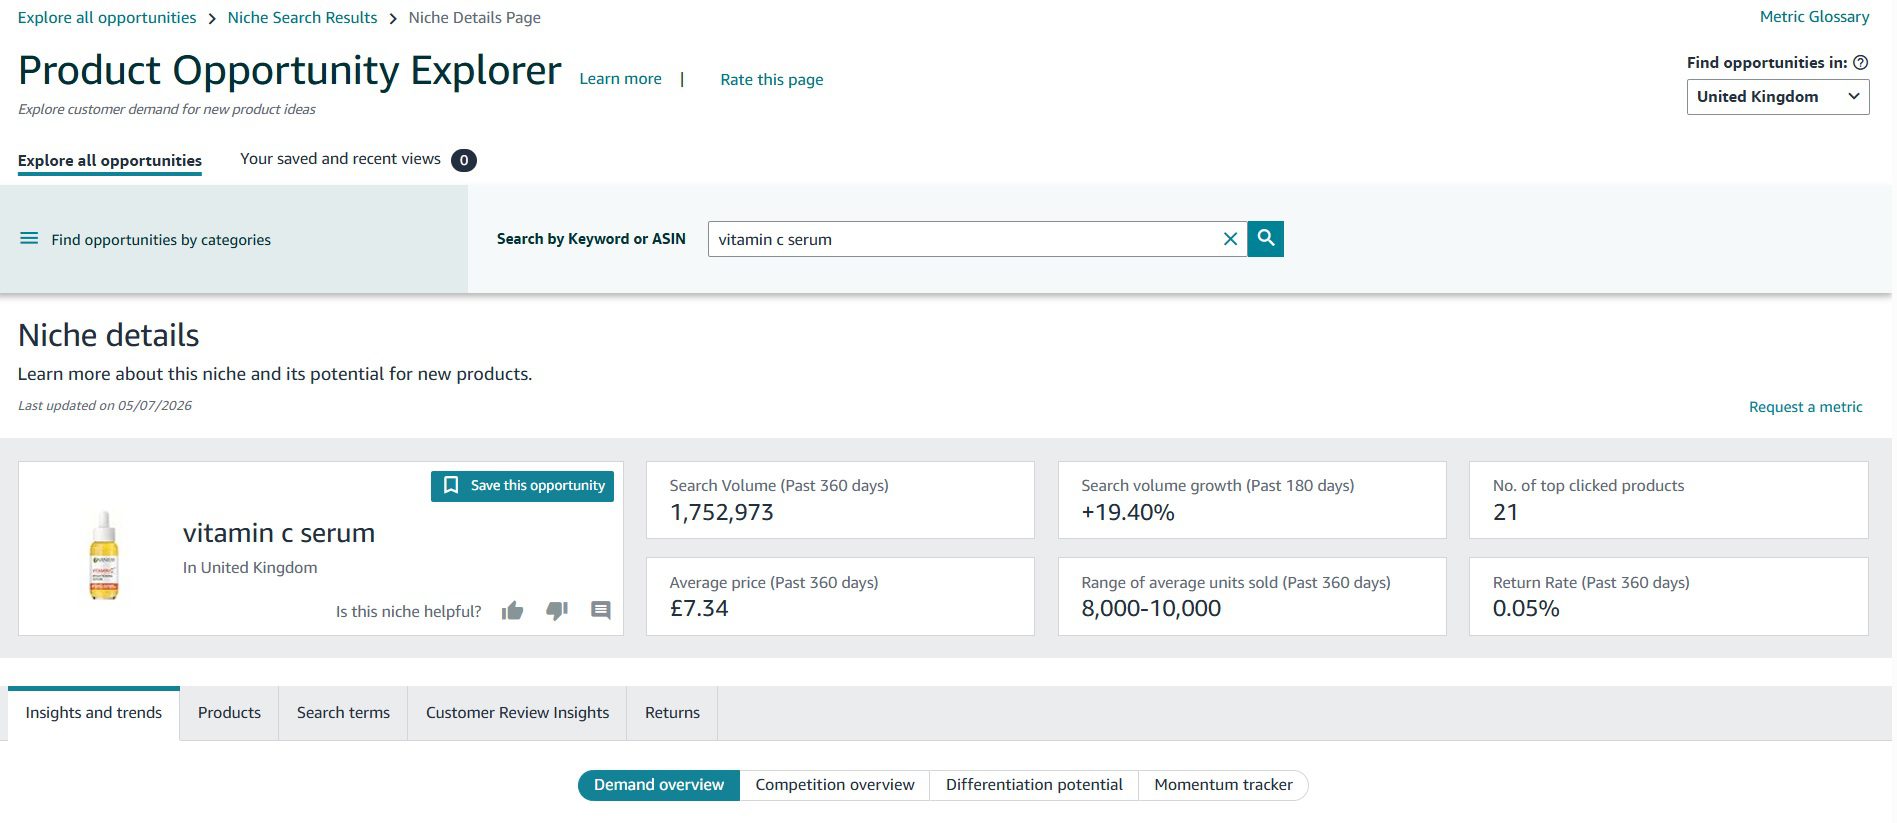
Screenshot displaying the five distinct product insight tabs—Insights and trends, Products, Search terms, Customer Review Insights, and Returns—within a niche inside Amazon Product Opportunity Explorer.
How to Find Niches in POE
POE works at three levels, and most sellers only ever use the middle one.

Screenshot demonstrating the primary search bar in POE, highlighting the ability to search for niches using broad keywords or specific ASINs.
At the first level, niche discovery, you enter a broad keyword and POE returns a list of related niches. Each row in the results table is its own customer need cluster, with its own search volume, growth, units sold, average price, and number of top clicked products.

Screenshot of the niche discovery level showing a list of related niches clustered by customer need, alongside search volume, units sold, and average price data.
At the second level, niche evaluation, you click into one of those niches and you land on the full niche details page with all five tabs.
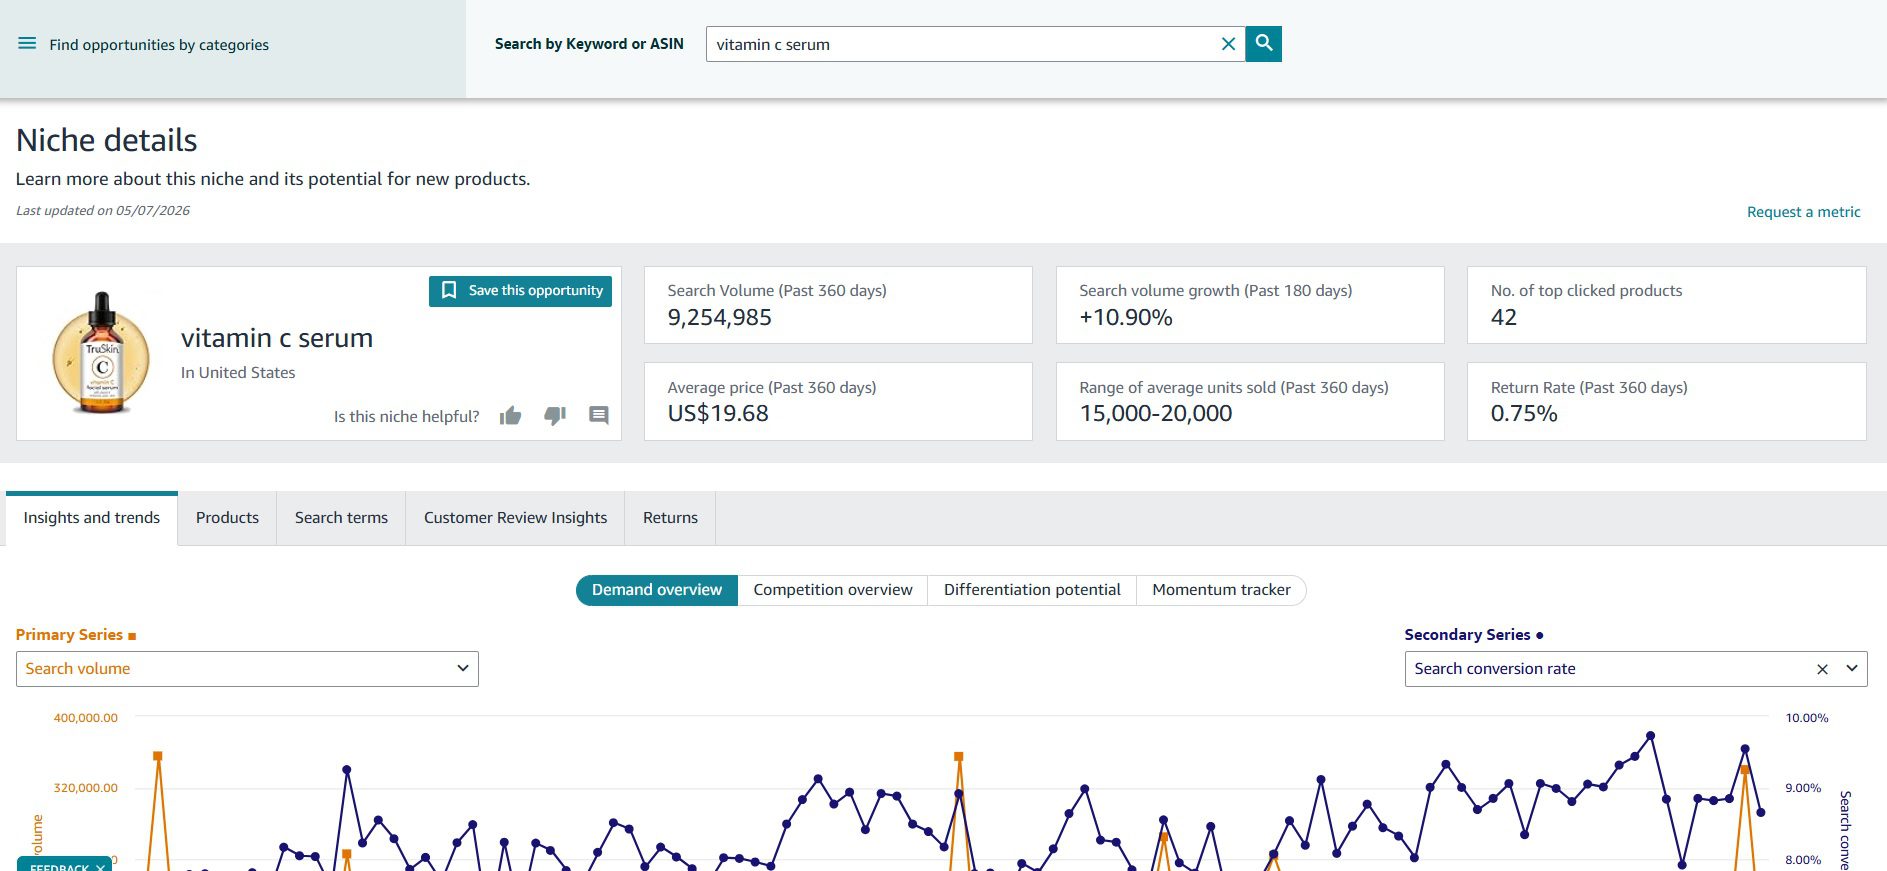
Screenshot illustrating the full, detailed niche view within POE, containing all five metric tabs for a complete opportunity breakdown.
How to Pick the Right Sub-Niche to Open
There are three ways to select niche when you search by keyword.
Screenshot detailing how to apply filters for search volume, growth, and top-clicked products to select the right sub-niche.
First, filter by search volume. If the sub-niche has fewer than 50,000 searches over the past 360 days, the niche is too small to support a launch for most sellers. Pass.
Second, filter by search volume growth. If the 90-day growth is negative by more than 20%, demand is contracting fast. The sub-niche may still be profitable but the window is closing. Pass unless you have a specific reason to ignore the trend.
Third, filter by number of top clicked products. If the sub-niche shows more than 25 top clicked products, the niche is fragmented. It can still work but it needs more research on the long tail. If it shows fewer than 10, the niche is concentrated and you will compete against a smaller set of entrenched products.
The Five Tabs Inside a Niche
When you open a niche, POE gives you five tabs. Each one answers a specific question a real seller has.
1. Insights and trends
This is the tab most sellers skip and the tab that actually tells you whether the niche is launchable. It shows Today, 90 days ago, and 360 days ago for every metric, broken into four sub-tabs:
- Demand overview: search volume, conversion rate, average price
- Competition overview: product count, brand count, click share
- Differentiation potential: OOS rate, ratings, reviews, returns
- Momentum tracker: trend direction across every metric at once
2. Products
Lists the top clicked ASINs in the niche. Every row gives you launch date, niche click count, click share, average price, ratings, BSR, and seller count. This is the tab you use to identify your competitors and to find sourcing targets.
3. Search terms
Lists the customer search queries grouped into the niche. Each row gives you search volume (360 days), growth (90 and 180 days), click share, conversion rate, and the top three products for that term. This is the tab that feeds PPC campaign structure.
4. Customer Review Insights
Groups the last six months of customer reviews into positive and negative topics with percentage mentions and sample snippets. The Topic Impact on Star Rating chart shows which topics correlate with higher or lower star ratings.
5. Returns
Groups return reasons by topic with mention percentages over the last six months. This is the closest thing Amazon gives you to a product failure map.
How to Read the Insights and Trends Tab
The Insights and Trends tab is where product launch decisions are made. Below are the metrics that matter and what each one means.
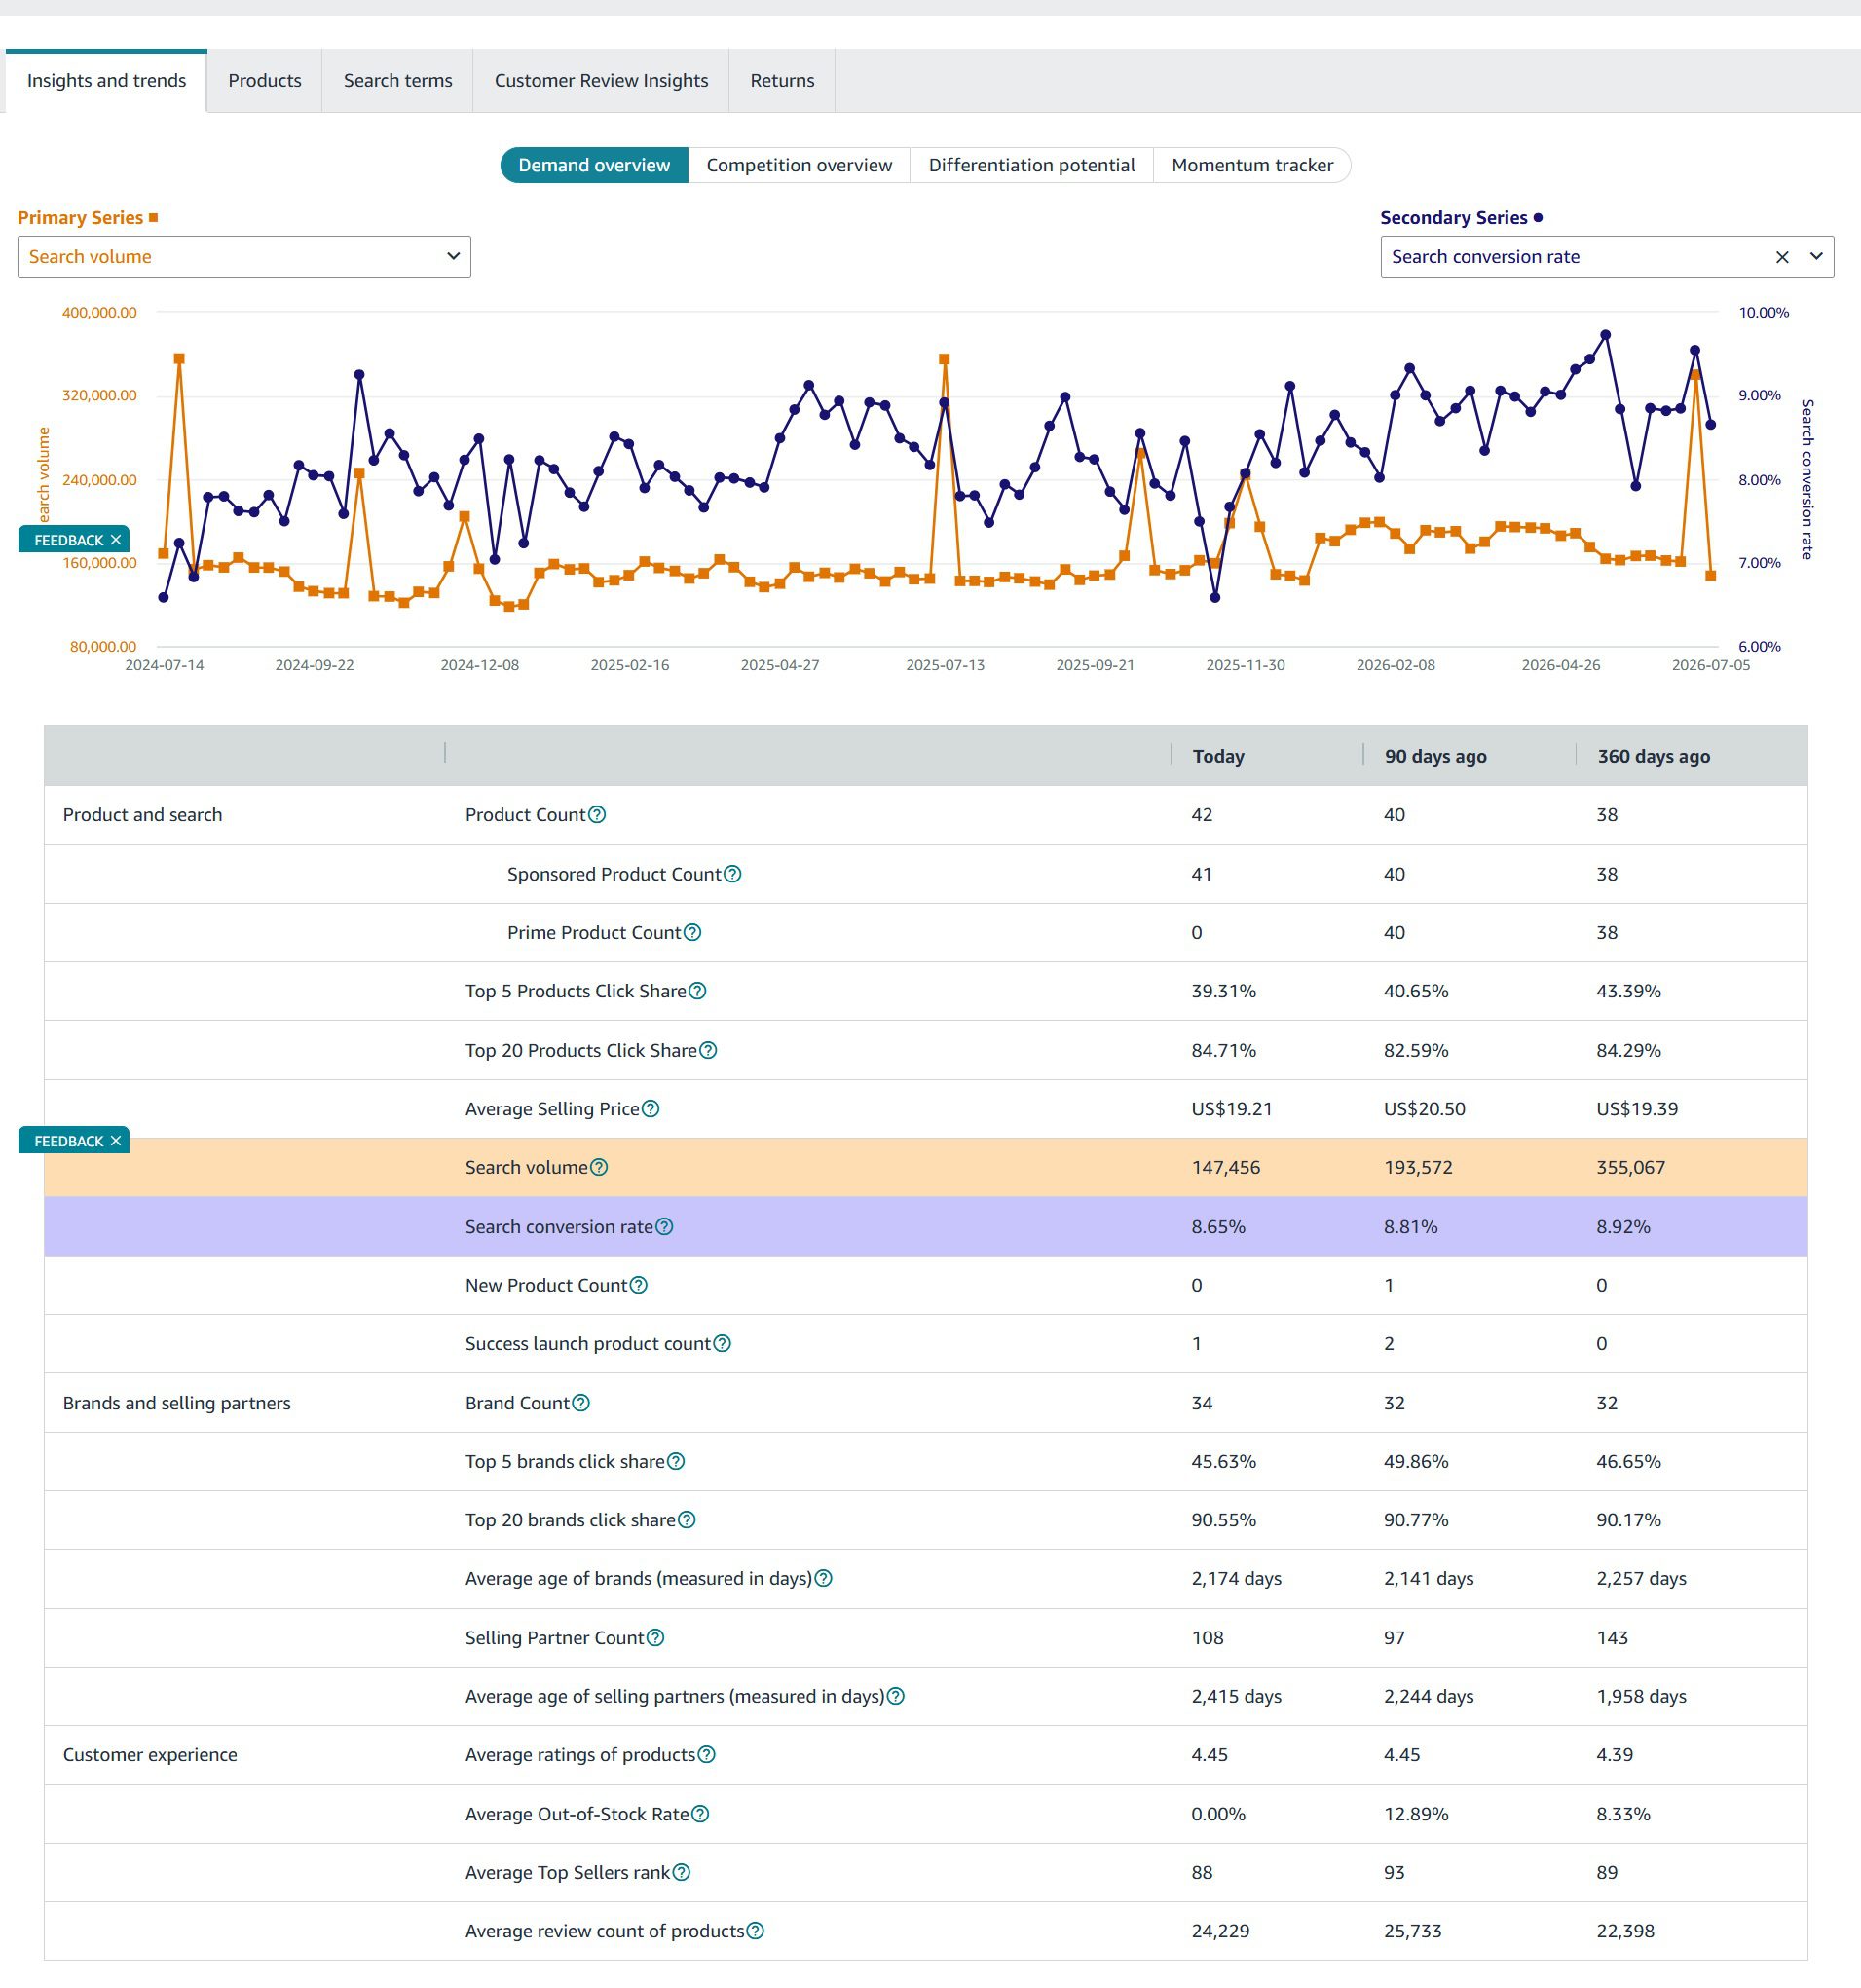
Screenshot of the Insights and Trends tab detailing the demand overview, competition level, and momentum trackers across different time windows.
New Product Count
Tells you how many new ASINs launched into the niche in the most recent window. A high count means the niche is attracting supply. A low count means sellers are not entering, which is either a sign of a dead market or a sign of an undiscovered opportunity. You cannot tell which from this metric alone, which is why the next metric matters.
Success Launch Product Count
Tells you how many of those new launches crossed the threshold Amazon uses to call a launch “successful.” Amazon does not publish the dollar amount, so treat the count as directional.
If New Product Count is high and Success Launch Product Count is low, new entrants are failing. Walk away. If Success Launch Product Count is high relative to New Product Count, the niche has a real success rate and is worth evaluating.
Top 5 Products Click Share
Percentage of clicks absorbed by the top 5 ASINs. If it sits above 70%, buyers are purchasing the top brands. As a new seller, you will struggle to get sales because customers and the algorithm both already have a default. Between 40% and 65% is workable. Below 40% usually means the niche is fragmented, which can mean opportunity or a dying niche.
Top 20 Products Click Share
At 100%, there is no long tail. If your launch is not in the top 20, your organic traffic ceiling is essentially zero.
Selling Partner Count
Number of sellers active in the niche across today, 90 days ago, and 360 days ago. If the count is falling sharply (say, from 118 down to 30 over a year), brands are exiting and the niche is contracting. Brands leave because demand is contracting. If the count is stable or rising, the niche is healthy.
Average Out-of-Stock Rate
How often the average ASIN in the niche is out of stock. A rising rate means demand is outrunning supply. Above 20% is a structural problem. Below 2% means oversupply and price wars. Monitor your Average Out-of-Stock Rate.
Average Selling Price
Mean price across the niche. This is your price ceiling. If your landed cost plus FBA fees plus advertising budget exceeds Average Price × 0.65, you are below the margin floor.
Search Conversion Rate
Purchases divided by clicks on any product in the niche. Below 6% is weak purchase intent. Above 9% is strong. The 5% to 7% range is the typical median for most consumer product niches.
How to Read the Products Tab
The Products tab lists the top clicked ASINs in the niche. Here are the columns and what each one tells you.
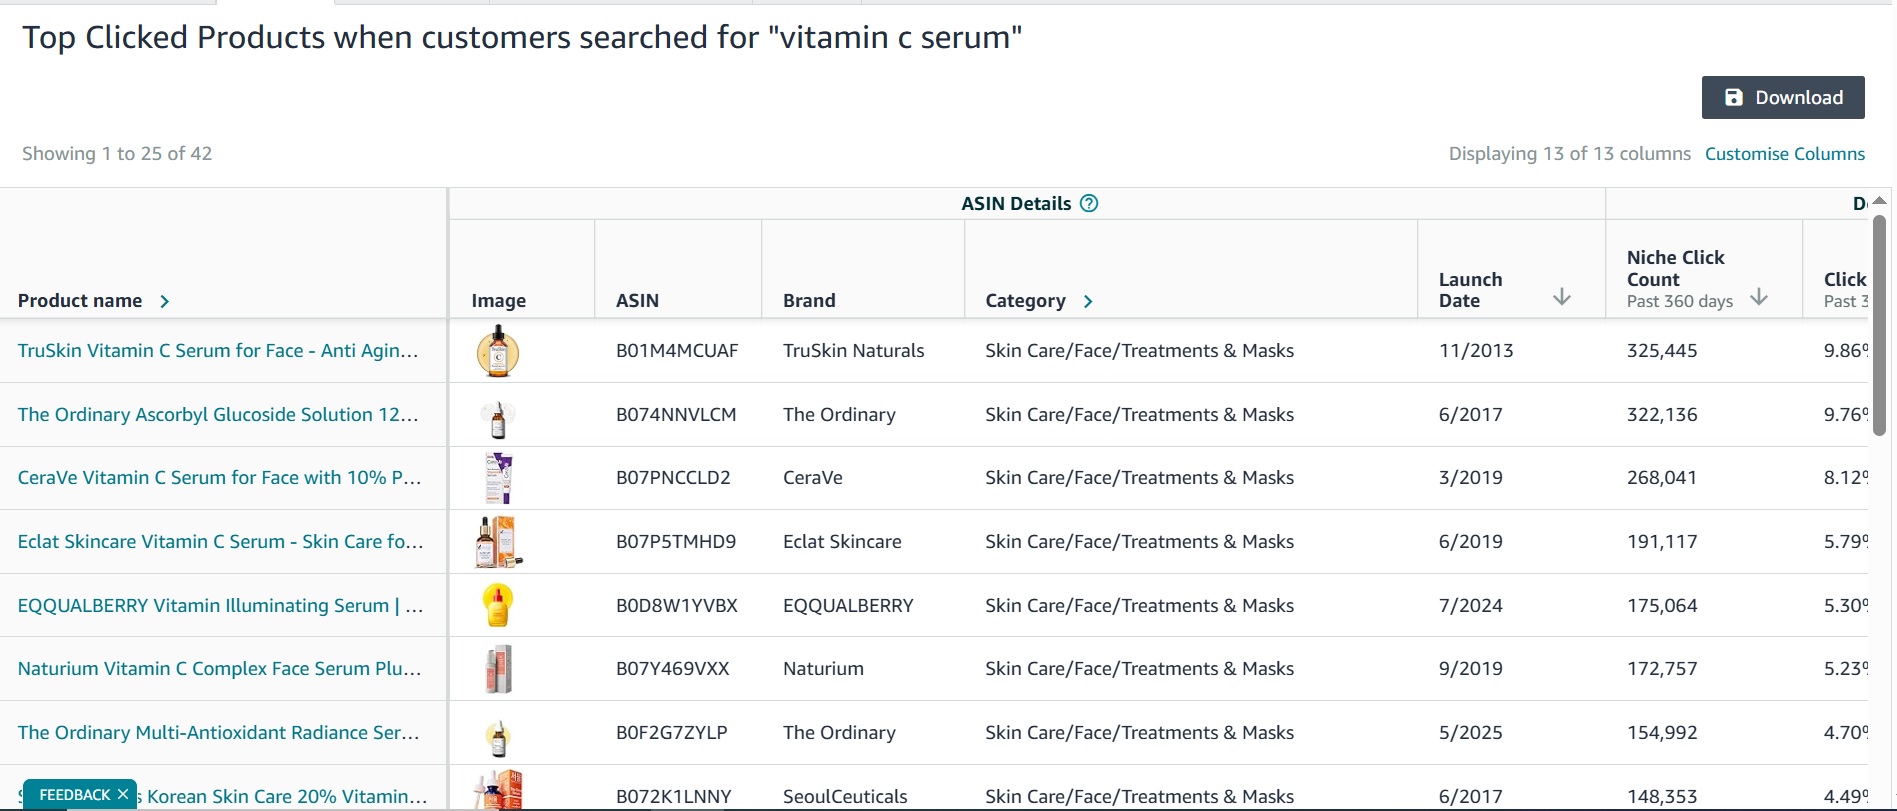
Screenshot of the Products tab presenting the top-clicked ASINs, click share percentages, and BSR metrics within the selected niche.
| Column | What it tells you |
|---|---|
| Product name and image | What the product is |
| ASIN | Amazon’s unique identifier |
| Brand | Which brand owns the listing |
| Category | Public category path |
| Launch Date | When the ASIN first sold on Amazon |
| Niche Click Count | Total clicks this ASIN absorbed in the niche, past 360 days |
| Click Share | Percentage of niche clicks going to this ASIN |
| Average Selling Price | Mean price, past 360 days |
| Total Ratings | Review count, past 360 days |
| Average Customer Rating | Mean star rating, past 360 days |
| Average Best Seller Rank | Mean BSR, past 360 days |
| Average Number of Sellers and Vendors | Buy Box competition level |
Sort by Niche Click Count. The ASINs at the top of the list are absorbing the most clicks, which means they have proven demand and proven ranking. These are your primary competitors. Old ASINs (4+ years) with stable BSR are the entrenched competitors. New ASINs (under 18 months) may still be in launch phase and could be delisted or rebranded.
How to Read the Search Terms Tab
The Search Terms tab shows the customer search queries grouped into the niche. Every row gives you search volume, growth rate, click share, conversion rate, and the top three products for that term.
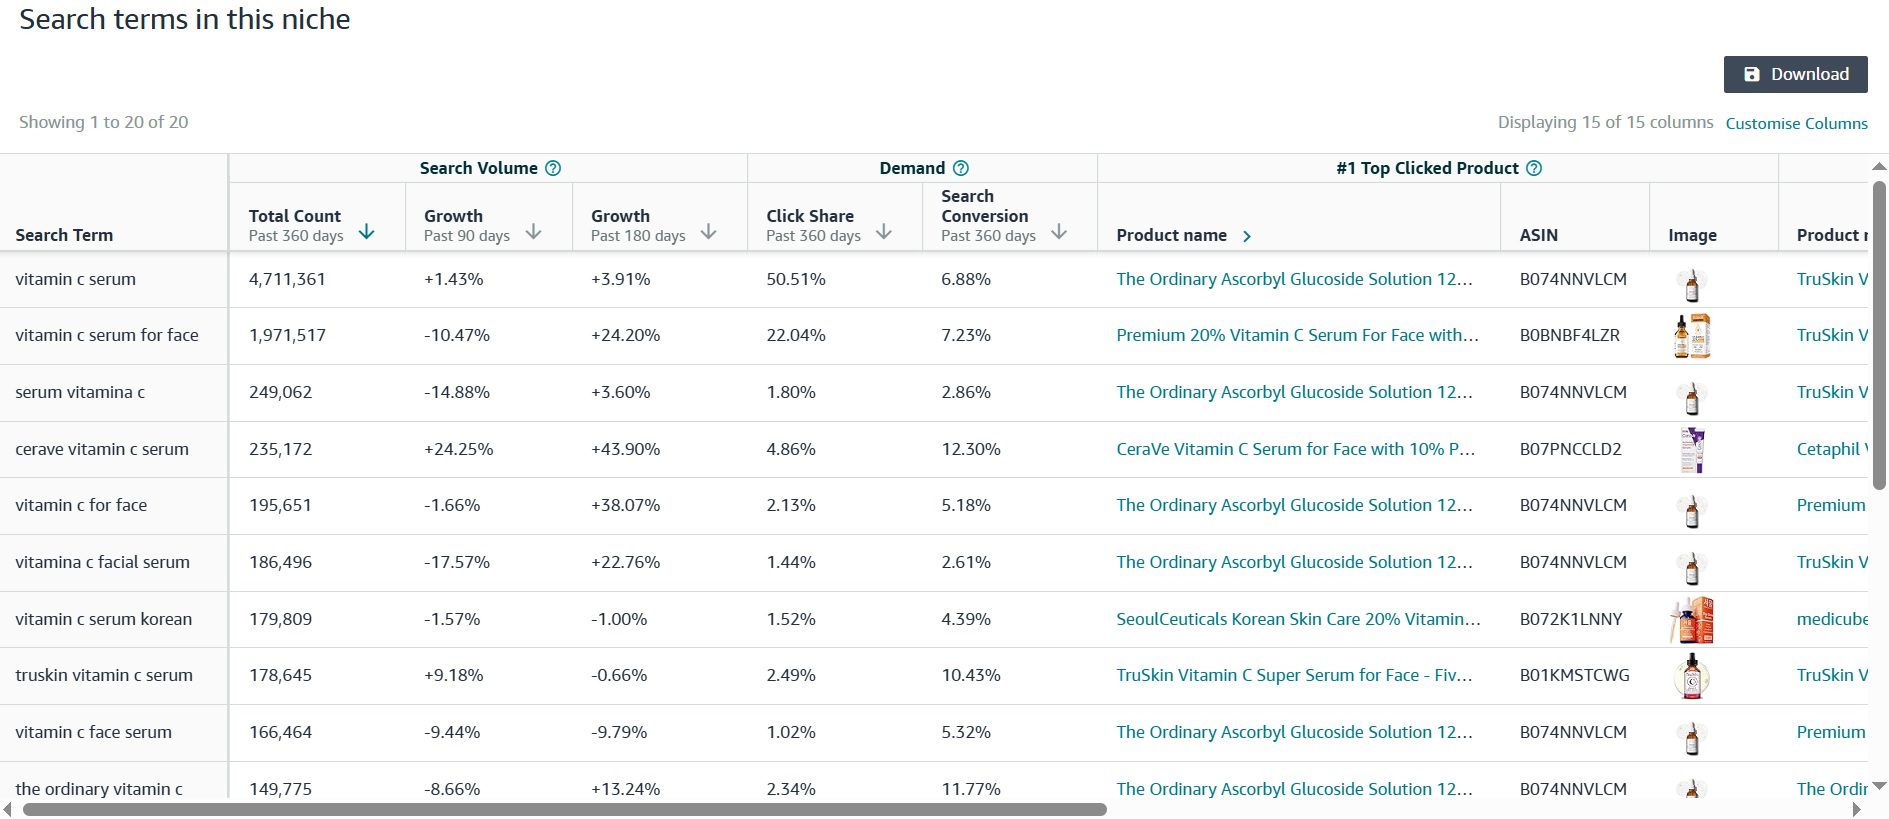
Screenshot highlighting the Search Terms tab, which displays exact customer queries, volume growth, search conversion rates, and the top products dominating each term.
| Column | What it tells you |
|---|---|
| Search Term | The exact customer query grouped into the niche |
| Total Count (Past 360 days) | Number of searches for this term over the last year |
| Growth (Past 90 days) | Short-term momentum compared to the prior 90 days |
| Growth (Past 180 days) | Medium-term momentum compared to the prior 180 days |
| Click Share (Past 360 days) | Percentage of niche clicks the term absorbs |
| Search Conversion (Past 360 days) | Purchases divided by clicks on any product after this term |
| Top 3 Clicked Products | The three ASINs dominating this term, with name, ASIN, and image |
Pull the top 10 to 15 search terms. These are your primary exact match keywords for a launch campaign. Add phrase match variants if your budget supports broader matching. Use Average Selling Price from the niche header as your AOV proxy. A safe exact match bid ceiling for a new launch sits between 8% and 12% of AOV for the first 30 days. Above 12% you almost never break even with no review history. Below 8% you do not get enough impressions to gather data.
Pick your competitor targeting ASINs from the Top 3 Clicked Products that appear across the most search terms. Bid below their organic click share to avoid paying for traffic that would have come to you anyway.
How to Read Customer Review Insights
Customer Review Insights is the tab most useful data and it is the tab that contains the actual product gap.
Open the tab. You will see positive and negative review topics from the last six months, with percentage mentions and sample snippets. The top positive topics tell you what customers love. The top negative topics tell you what customers hate.
The product gap is at the intersection: a negative topic with high percentage mentions where the Top 3 Clicked Products are not solving the problem in their listings. If 18% of return reasons are “Functionality-Overall” and the top products are not emphasizing durability in their bullet points, durability is your wedge.
This is also where you stop guessing what product to build. Read what customers are already telling Amazon, then build the product that does not have the failure they keep mentioning.
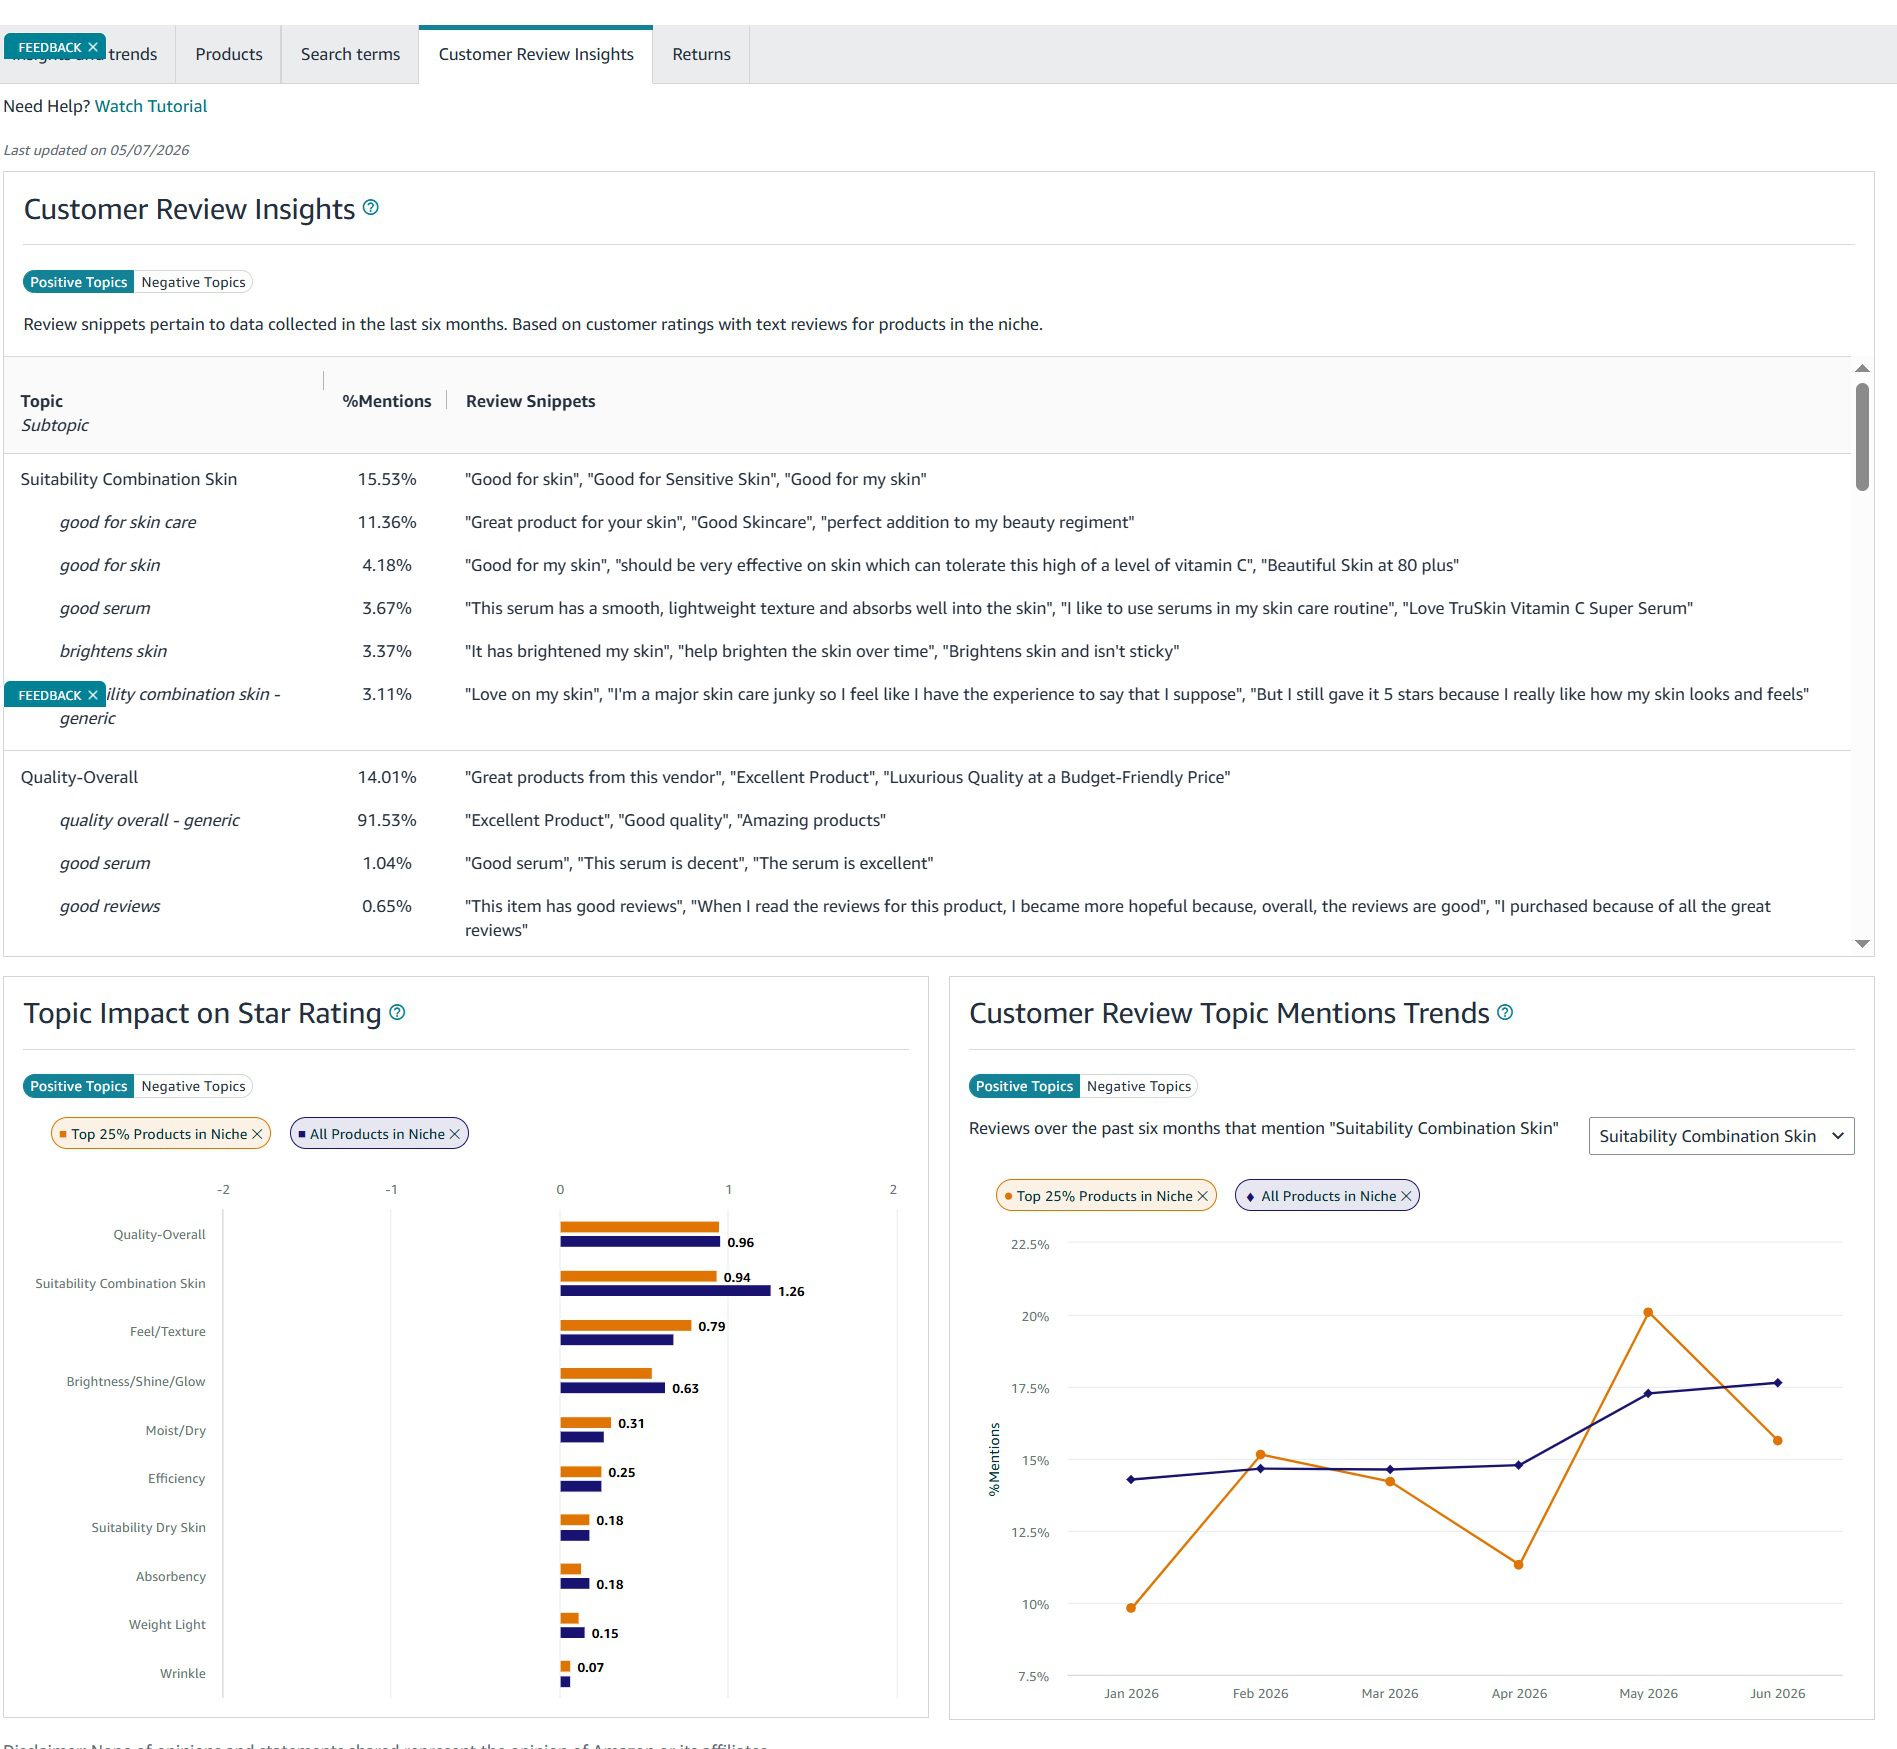
Screenshot of the Customer Review Insights tab detailing positive and negative review topics, mention percentages, and their direct impact on star ratings.
How to Read the Returns Tab Before You Commit
The Returns tab groups return reasons by topic with mention percentages over the last six months. This is the closest thing Amazon gives you to a product failure map.
If Functionality-Overall returns are above 20%, the niche has widespread product failures. Launching into that niche means you have to demonstrably beat the existing quality bar or you will inherit the same return rate. A return rate below 5% is generally safe to source without deep quality conversations.
Walking into every niche decision knowing the failure pattern keeps you from being surprised by returns six months after launch.

Screenshot of the Returns tab organizing customer return reasons by topic, acting as a real-world map for potential product failures.
How to Decide if a Niche is Launchable
Run these checks in order before launching to a new product.
1. New Product Count vs Successful Launch Count
If new launches are failing (high New Product Count, low Successful Launch Count), walk away. Flip side: a low number of new product launches coupled with a high number of successful launches in the previous quarter is a genuinely good sign, it means the niche rewards good execution instead of burning through every new entrant.
2. Top 5 Products Click Share
Above 70%, the niche is dominated by entrenched brands and you’ll struggle to rank. Between 40% and 65%, it’s workable.
3. Top 20 Products Click Share
At 100% click share, there’s no organic traffic available outside the top 20. If your launch isn’t going to land inside that range, your product may fail.
4. Search Volume vs Product Count
High search volume combined with a low number of products and low click concentration is the ideal scenario for launching, since it points to low competition and high customer demand. Look for search volume above 10,000/month paired with product count under 50 shows real demand without much competition.
5. % Prime Products and % Sponsored Products
A low percentage of Prime-eligible products in the niche means sellers can quickly gain momentum by simply adding a Prime offer. Similarly, a low percentage of products running Sponsored Products indicates a less competitive space where you can launch without burning ad spend just to survive.
6. Brand Concentration and Average Brand Age
Check how many distinct brands sit in the niche and how old they are on average. A niche with a handful of long-established brands holding most of the click share is a different launch problem than one where brands are fragmented and relatively young, the second is far more accessible.
7. Average Out-of-Stock Rate
Use this to gauge unmet supply. A high OOS rate across the niche’s top products means existing sellers can’t keep up with demand consistently, which is a direct opening for a competitor with better inventory planning.
POE vs. Third-Party Research Tools
| Capability | POE | Helium 10 | Jungle Scout | AMZScout |
|---|---|---|---|---|
| Data source | Amazon first-party | Amazon + estimated | Amazon + estimated | Amazon + estimated |
| Brand Registry required | Yes | No | No | No |
| Click share data | Yes | No | No | No |
| Search conversion rate | Yes | No | No | No |
| Returns topic breakdown | Yes | No | No | No |
| Customer review topic breakdown | Yes | Partial | Partial | Partial |
| Estimated monthly revenue | No | Yes | Yes | Yes |
| Estimated BSR trend over time | Limited | Yes | Yes | Yes |
| Price | Free with Brand Registry | From $39/month | From $49/month | From $50/month |
POE is the most reliable source for click share, conversion rate, returns, and review data because the data is Amazon’s own. Third-party tools are better for revenue estimation, BSR trend tracking, and competitor offer depth. Use POE for niche-level opportunity filtering. Use a third-party tool for revenue modeling and historical trend tracking.
Ready to Discover Profitable Niches?
We review your product launch strategy, POE data, and competition analysis for free. No commitment.