
Amazon Competitor Analysis: A Step-by-Step Guide for Sellers
Amazon competitor analysis is the process of studying the products that compete with yours for the same search terms and the same shoppers, then using what you learn to improve your own listing, pricing, keywords, and advertising.

Amazon competitor analysis is the process of studying the products that compete with yours for the same search terms and the same shoppers, then using what you learn to improve your own listing, pricing, keywords, and advertising.
This article covers who your real competitors are, how much they sell, what the market rewards in offer and price, which keywords they rank for, what their customers complain about, and how they spend on ads.
Each of the ten steps below ends with something you change on your own account. If a step doesn’t change anything, you did homework, not analysis.
Why Competitor Analysis Matters on Amazon
Every product on Amazon shares its page one with direct alternatives, and shoppers compare them in seconds before clicking. This is why competitor analysis directly affects revenue, and why it belongs at the start of your strategy rather than the end. Here is what it changes in practice.
It sets your price before the market sets it for you
Without competitor data, most sellers price from their costs. Shoppers judge your price against the other products on the same results page. Competitor analysis shows you the price band the niche actually buys in, so you can position inside it deliberately instead of discovering it through slow sales.
It shows you which keywords already produce sales
Competitors who rank ahead of you have already tested the market with their own money. Their keyword rankings show which search terms drive purchases in your niche, which removes months of guesswork from your listing and PPC strategy.
It protects your ad budget
CPC on Amazon is set by auction, and the auction is set by your competitors. Knowing who bids on your keywords, how strong their listings are, and where they stop spending tells you which keywords are worth entering and which will only consume budget.
It reveals product improvements before you pay for them
Competitor reviews and return complaints show what buyers in your niche dislike, before you place a purchase order. Correcting a known weakness in your next production run costs far less than discovering it through your own returns.
It tells you when to act
A competitor raising prices, going out of stock, or losing rating is a short window to gain rank and sales at low cost. Sellers who track competitors see these windows. Sellers who do not, find out after the window closes.
What to Audit in Your Competitors
Before starting the ten steps, it helps to know exactly which parts of a competitor’s business you can examine and what each one tells you. Every item below is visible from public data or standard tools.
| Audit area | What to examine | What it tells you |
|---|---|---|
| Keywords | Organic rankings, sponsored placements | Which search terms produce their sales |
| Listing | Main image, title, bullets, A+ content | Why they win or lose the click and the sale |
| Price | Current price, coupon, price history, per-unit price | Their real operating price and deal schedule |
| Reviews | Rating, review count, complaint patterns | Product weaknesses you can improve on |
| Sales | Estimated units and revenue, BSR trend | Their sales volume and your share of the niche |
| Advertising | Ad placements, ad types, targeting on your listing | Where they spend and how aggressively |
| Offer | Pack size, variations, bundle, fulfillment method | How their offer structure differs from yours |
| Inventory | Stock levels, out-of-stock history | When their supply gaps create your opportunity |
You will not audit all eight areas every week. The ten steps below cover each of them in order, and the schedule at the end of this article shows which ones to revisit weekly, monthly, and quarterly.
Step 1: Search Your Main Keyword and Build Two Competitor Lists
Start where the shopper starts. Type your main keyword into the Amazon search bar and study the first page of results. The products ranking at the top of that page are the competitors that matter, because they’re the ones taking the clicks you want.
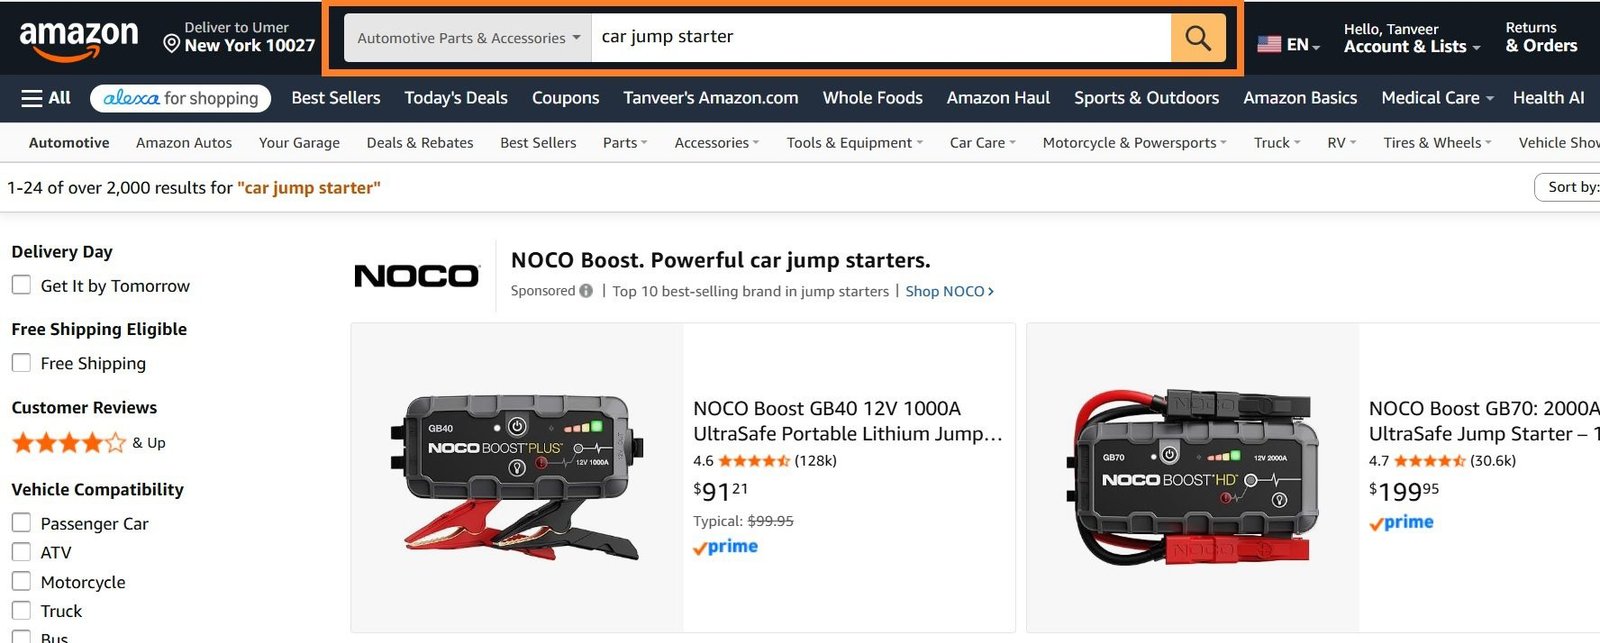
Searching the main keyword in the Amazon search bar. The products ranking at the top of page one are the real competitors for this search term, because they are the ones receiving the clicks and sales you are targeting.
As you scan page one, look for the products that genuinely match yours: same design, same pack size, same flavour, same use case. A shopper comparing 3-packs of mango gummies isn’t cross-shopping a single-pack peach option, so neither should you. Repeat the search for your 3 to 5 most important keywords, because page one changes from term to term and some competitors only appear on certain searches.
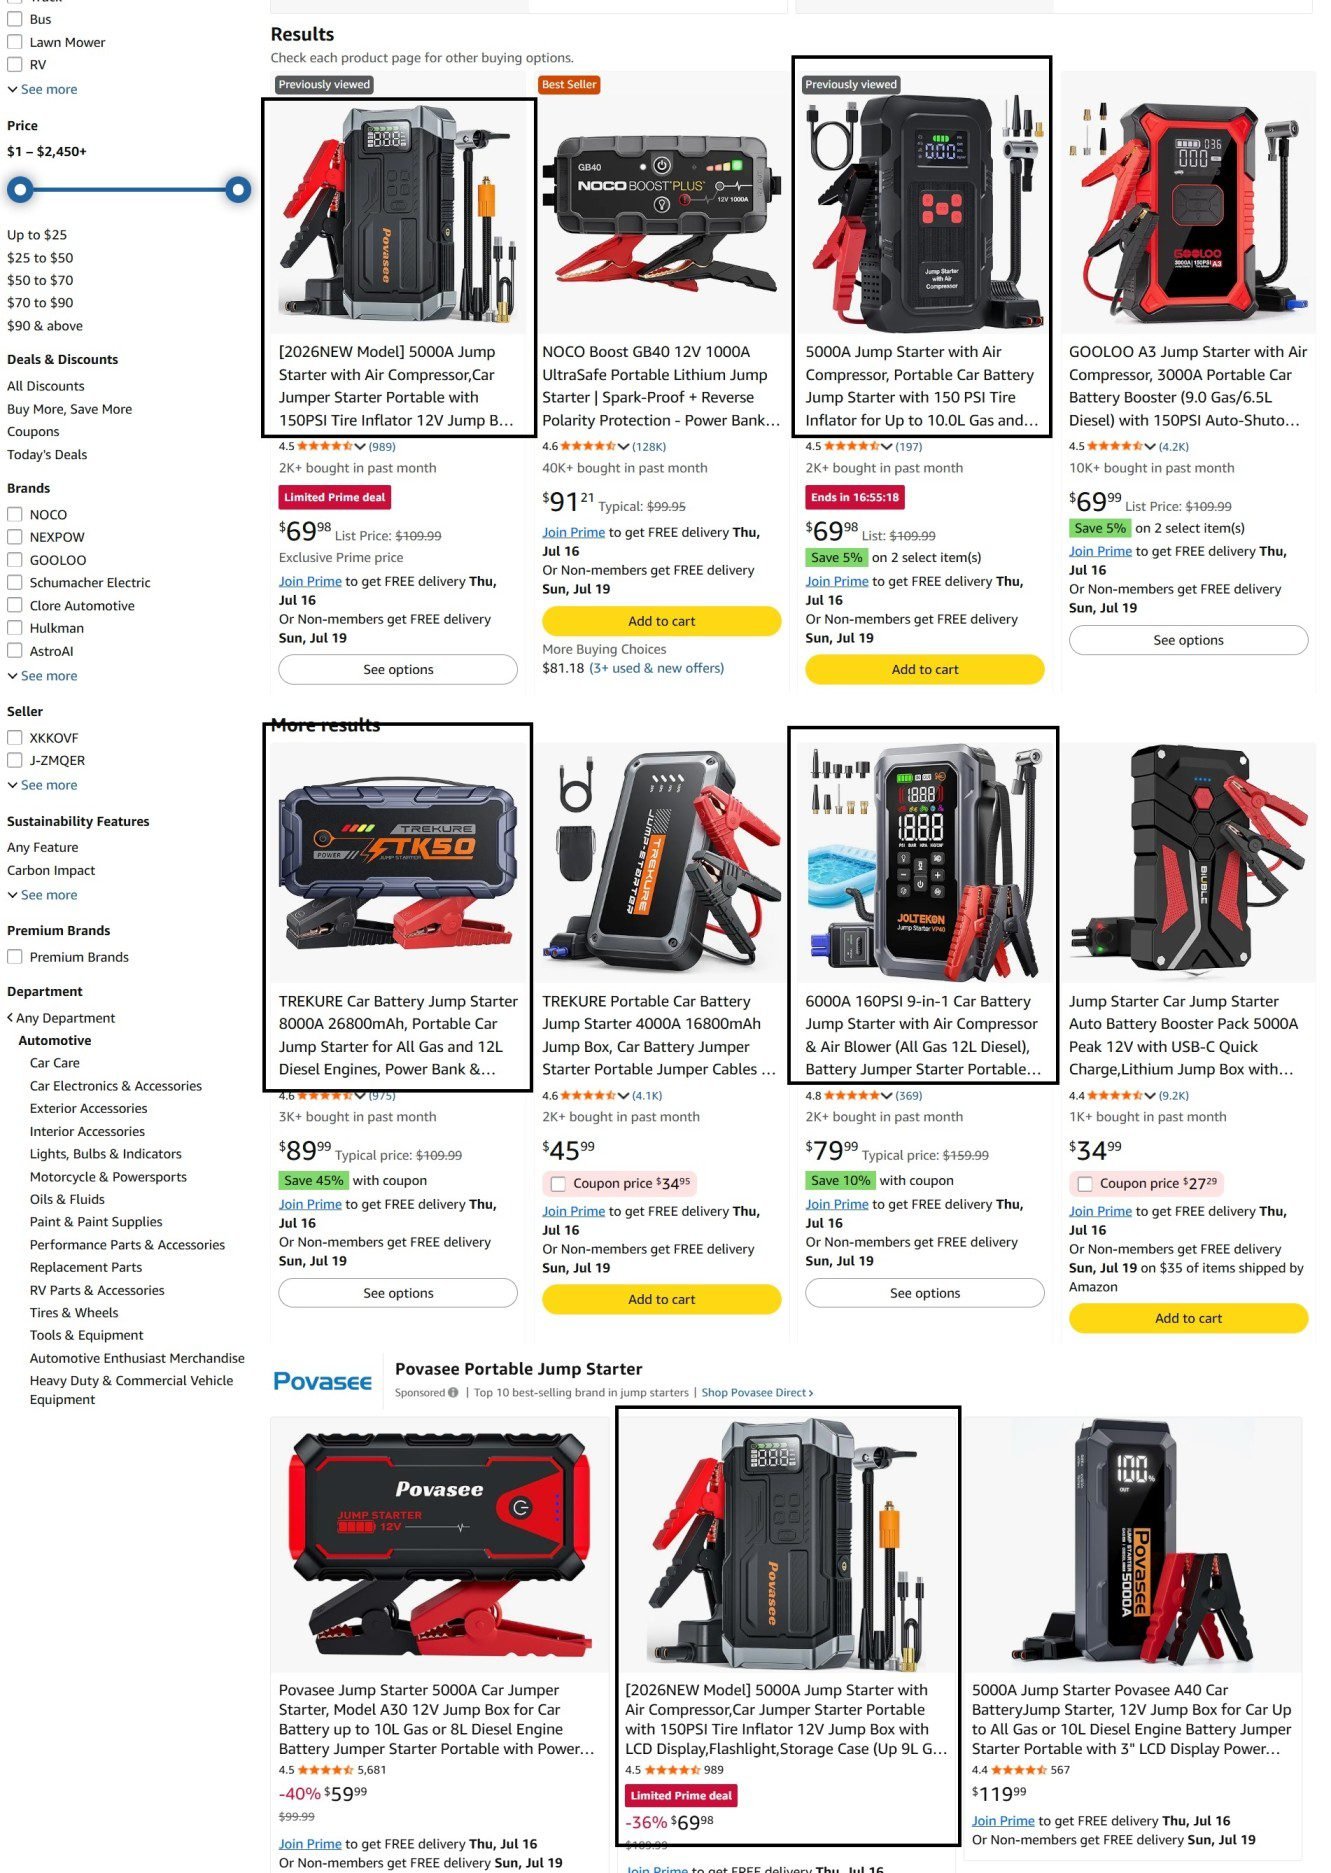
Marking 7 to 10 relevant competitors on the results page and noting down their ASINs for the reverse-ASIN research in Step 5. Give preference to competitors with lower review counts, because they show what a newer product can realistically compete against.
From what you find, build two separate lists:
- List 1, your keyword list (7 to 10 competitors). These are the top-ranking products related to yours, even if they differ a little in pack size or flavour. This list has one job: feeding the reverse-ASIN keyword research in Step 5, where a wider net gives you a bigger keyword universe.
- List 2, your tracking list (3 to 5 competitors). These are the products nearly identical to yours in design, pack size, flavour, and price. These are the ones you’ll watch closely: their price moves, their review growth, their rankings, and their ads. Everything from Step 6 onward runs against this list.
Why two lists? Because the jobs are different. Keyword research rewards breadth, while tracking rewards focus. We’ve watched 20-ASIN tracking sheets on our own client accounts get updated twice and then die. Three to five competitors is what one person can actually maintain.
Pro tip: if one giant brand owns the top of page one at a price you can’t match, leave them off your tracking list. A brand with 40,000 reviews isn’t your competitor.
Step 2: Read Click Share and Conversion Share Before Anything Else
Once you know who your competitors are, the next step is to know how strong their market share is.
Two numbers inside the Brand Analytics Top Search Terms report answer that better than any paid tool: click share and conversion share for the top 3 clicked ASINs on each of your money keywords.
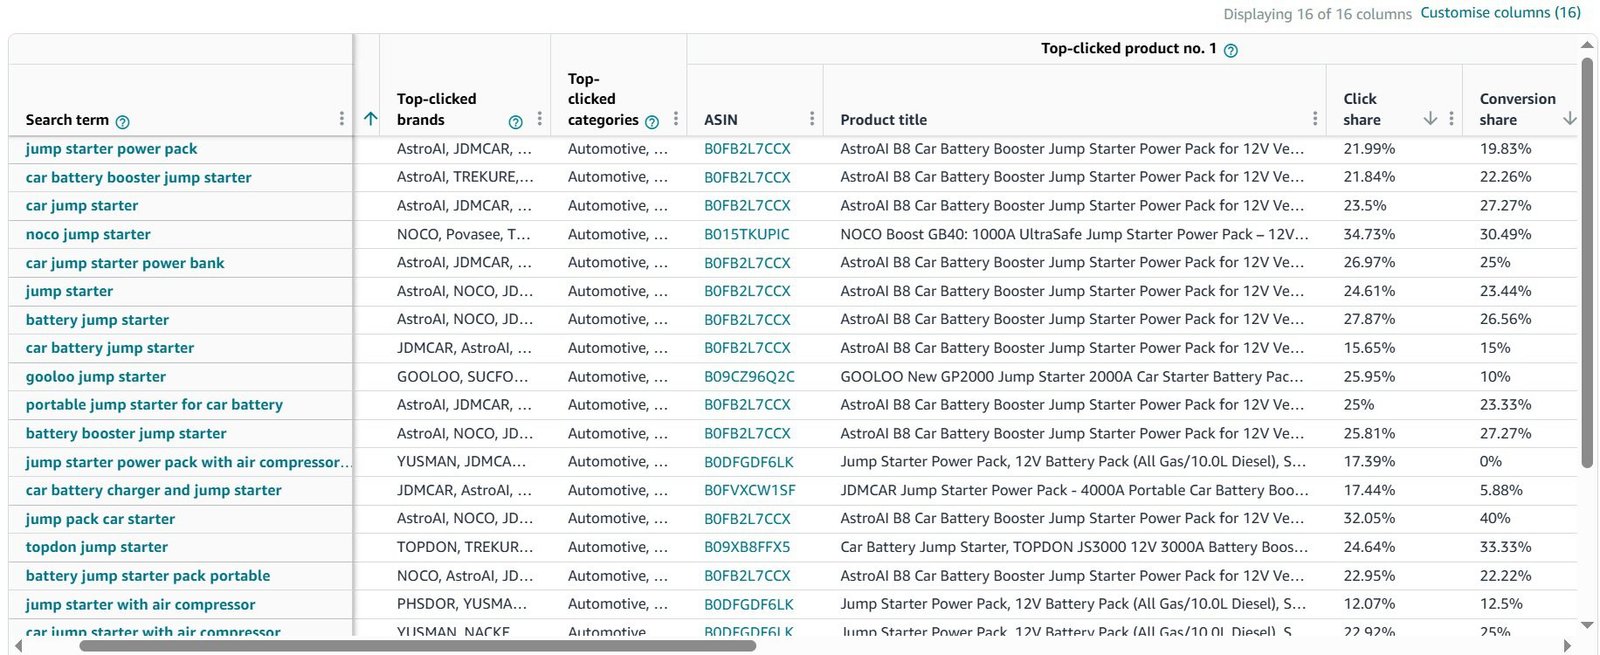
The Top Search Terms report inside Amazon Brand Analytics. For every search term it shows the three most clicked ASINs along with each one’s click share and conversion share, which tells you who wins the term and whether they convert the clicks they take.
Read the two numbers together, because the combinations point to very different problems:
- High click share, high conversion share. This ASIN simply wins the search. Study its main image, price, and review count, because that’s your benchmark.
- High click share, low conversion share. The listing attracts clicks but loses the sale. This is the competitor you can beat fastest, usually on price, review rating, or A+ content.
- Low click share, high conversion share. A niche product converting a very specific buyer. Check whether it targets a use case your listing ignores.
Amazon Search Query Performance (SQP) shows your impression share, click share, and purchase share for every query, so you can see exactly which stage of the funnel you’re losing at.
On a Sports and Outdoors account in our portfolio, SQP data showed the brand earning plenty of impressions on its seasonal head terms but losing the click. Fixing the main image and title, alongside a seasonal PPC push produced a 32% CTR improvement, a 25% higher conversion rate, and $2.5M in revenue in 8 months.
Step 3: Estimate Their Sales and Your Share of the Niche
You can’t see a competitor’s sales directly, but sales estimation tools get close enough to make real decisions. We use Helium 10 X-Ray for this, and Jungle Scout does the same job well.
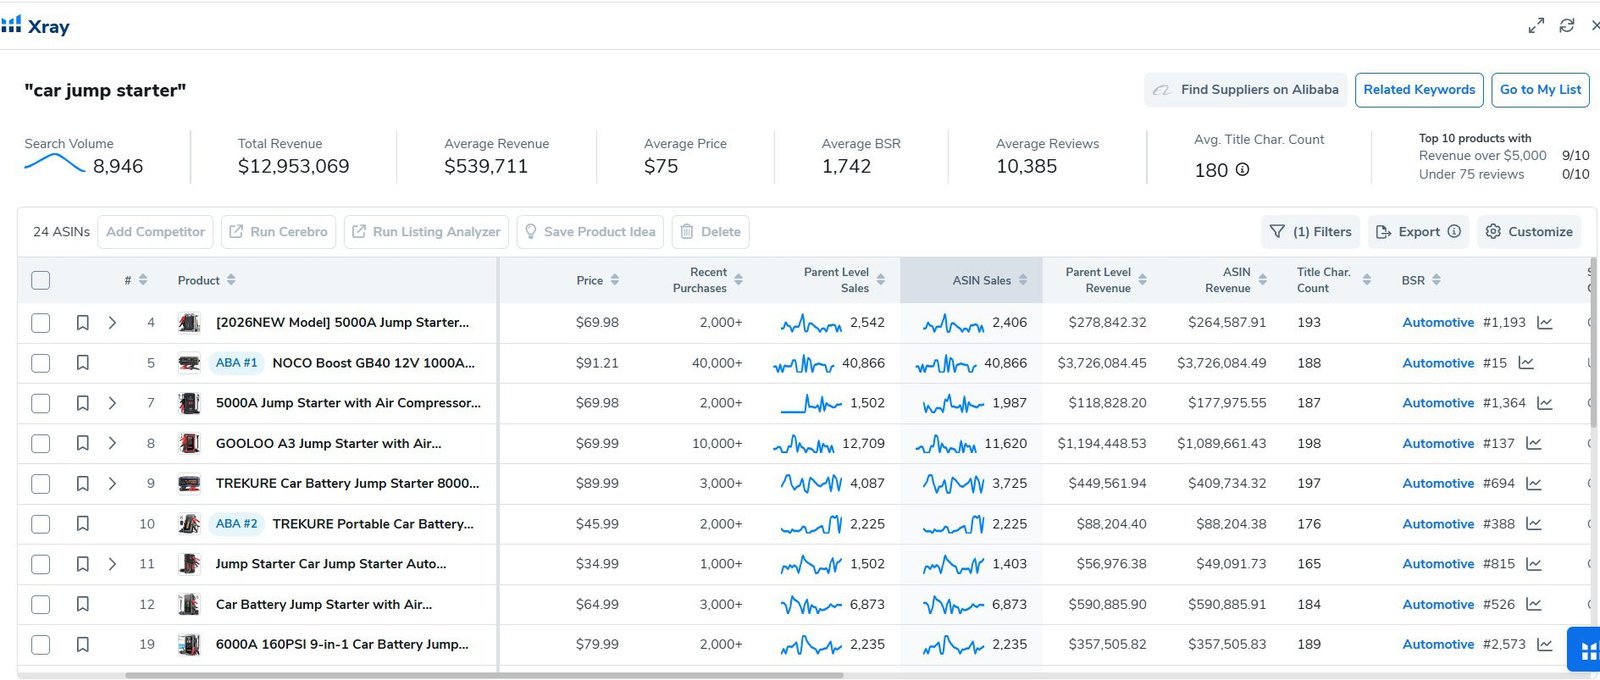
Helium 10 X-Ray opened on the Amazon search results page. It shows estimated monthly revenue, units sold, price, review count, and BSR for every competitor in the niche, giving you the market size and each seller’s position in one table.
Run your main keyword search on Amazon, open X-Ray on the results page, and you get the whole niche in one table: estimated monthly units and revenue for every ASIN, plus price, review count, rating, and BSR. Export that table, because you’ll use it again for the market analysis in Step 4.
Here’s what to pull from the data:
- The sales gap between you and the leaders. If the top ASIN moves an estimated 4,000 units a month and you move 300, you’re not ready to fight them head on, and your keyword strategy should reflect that.
- Your market share. Divide your monthly units by the combined units of your tracking-list competitors plus your own, and you have a working share number. On one supplement account, that simple calculation showed the client at 4% of a niche where the top ASIN held roughly 38%, and that single number redirected the whole engagement away from head-term bidding wars and into mid-tail keywords.
- Where the revenue concentrates. If the top 3 ASINs take 70% or more of niche revenue, you’re in a winner-take-all market and you’ll have to out-convert the leaders. If revenue spreads across 15 sellers, there’s room to grow without direct confrontation.
Remember that estimates are estimates. These tools read BSR, and BSR reacts to short-term spikes, so a competitor who ran a Lightning Deal yesterday will show an inflated monthly figure for days afterward.
Step 4: Analyze the Market to Find What Shoppers Already Buy
Now take that same X-Ray export and ask a different question: what is the market already rewarding? Before you commit to an offer or a price point, you want to know what shoppers in this niche actually spend their money on.
Go through the export and tag each competitor by its attributes: design or style, colour, pack size, flavour, material, whatever the real buying dimensions are in your niche. Then count where the revenue sits.
Fifteen sellers offering single packs and five offering 3-packs tells you nothing on its own. But if those five 3-pack sellers take 60% of niche revenue, the market has voted for the 3-pack, and a new single-pack launch starts with a handicap.
Here’s what that read looks like in practice, with sample figures:
| Pack size | Number of sellers | Share of niche revenue | Average price | Price per unit |
|---|---|---|---|---|
| Pack of 1 | 14 | 25% | $12.99 | $12.99 |
| Pack of 2 | 6 | 20% | $21.99 | $11.00 |
| Pack of 3 | 5 | 55% | $27.99 | $9.33 |
Sample data for illustration. Build this table from your own X-Ray export.
The sample data above shows that pack of 3 takes over half the revenue with the fewest sellers, and it wins while charging the lowest per-unit price. If you sell a pack of 3, your price point lives near $27.99 and your cost structure has to survive $9.33 per unit. If you sell a single pack, you’re fighting 14 sellers for a quarter of the market. That’s the decision this step produces: which offer to run, and what price it has to hit.
Run the same maths on every attribute that matters in your niche: dominant flavour, colour, size, material. Where one attribute clearly wins, match it. Where revenue spreads evenly, that’s your room to differentiate.
Pro tip: Watch out for a single giant ASIN dragging the averages. If one product takes 45% of niche revenue by itself, run the table with and without it, because the market minus the outlier often votes differently.
Step 5: Run a Reverse-ASIN Search to Find the Keyword Gap
Take your 7 to 10 competitors and run their ASINs through Helium 10 Cerebro in one multi-ASIN search, then download the full keyword list. What you’re holding now is the keyword universe your entire niche runs on. The next filters cut it down to the keywords worth acting on.
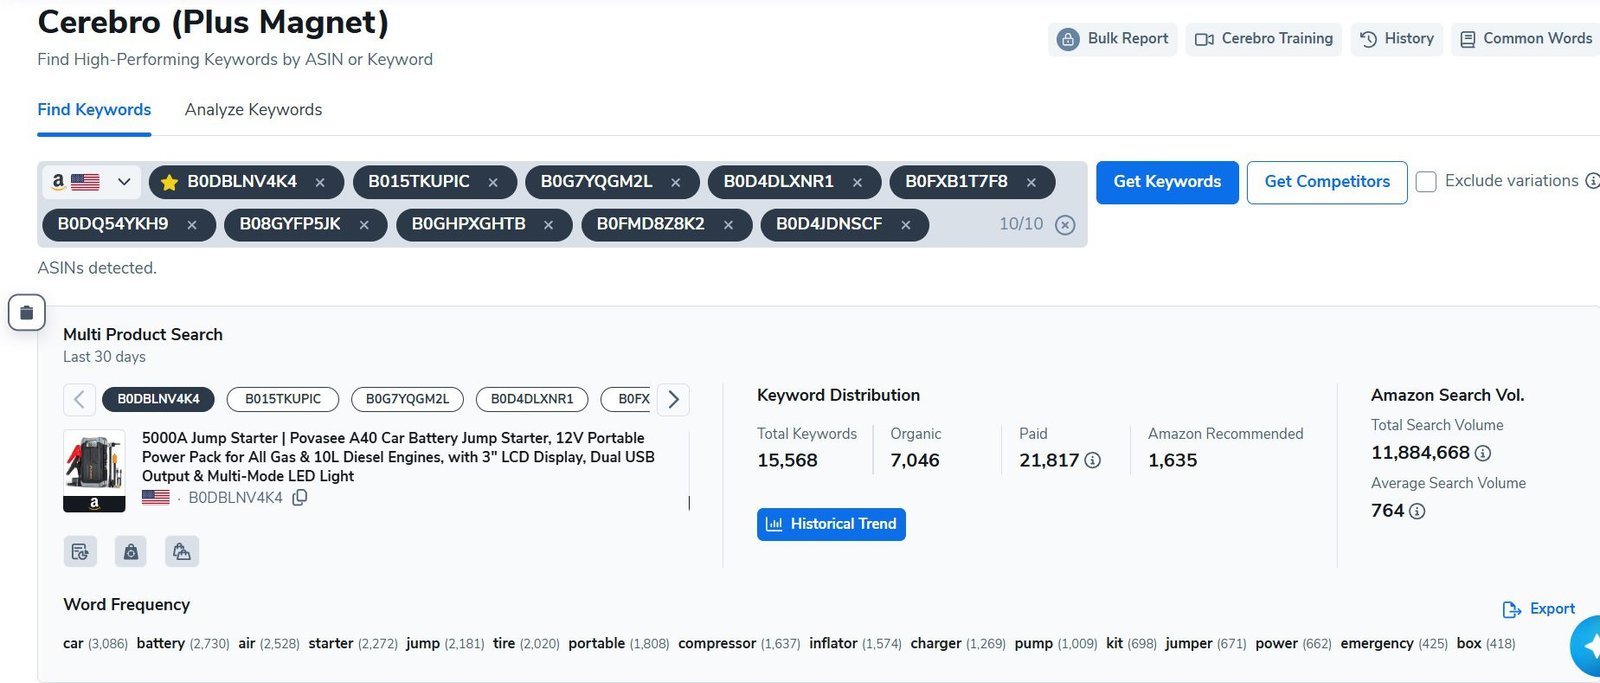
Helium 10 Cerebro with the competitor ASINs from List 1 entered for a single multi-ASIN reverse search. Running all 7 to 10 competitors together produces the complete keyword universe the niche ranks and advertises on.
From there, judge the competition on each keyword using five columns in the export:
- Start with the Competitor Performance Score. Cerebro scores every keyword from 0 to 10 based on how well your competitor set performs on it, where 10 is highly relevant and 0 is noise. Filter to between 5 and 10, and you have your working list: these are the keywords going into your listing and your PPC campaigns.
- Sponsored ASINs. How many ASINs are running Amazon PPC ads on this keyword. Fewer sponsored ASINs means more room for your PPC to work and to push organic rank. A high-volume keyword with few advertisers is exactly the find you’re looking for.
- Competing Products. How many products, organic plus paid, are competing on the keyword. A value under 1,000 signals low competition. The higher this number climbs, the more crowded the term and the higher the CPC you should expect to pay.
- CPR. The number of orders you need on this specific keyword within 8 days to rank on page one. A keyword with a CPR of 40 needs 5 sales a day for 8 days through that search. Always compare CPR against your realistic daily order capacity before choosing launch keywords, because a CPR of 300 on a head term is a budget statement, not a suggestion.
- Ranking Competitors. How many of your top 10 competitors already rank on this keyword. More competitors ranking validates that the keyword sells, but it also brings more competition. The sweet spot is a keyword where 2 or 3 competitors rank well, the volume is real, and Sponsored ASINs and CPR are both low.
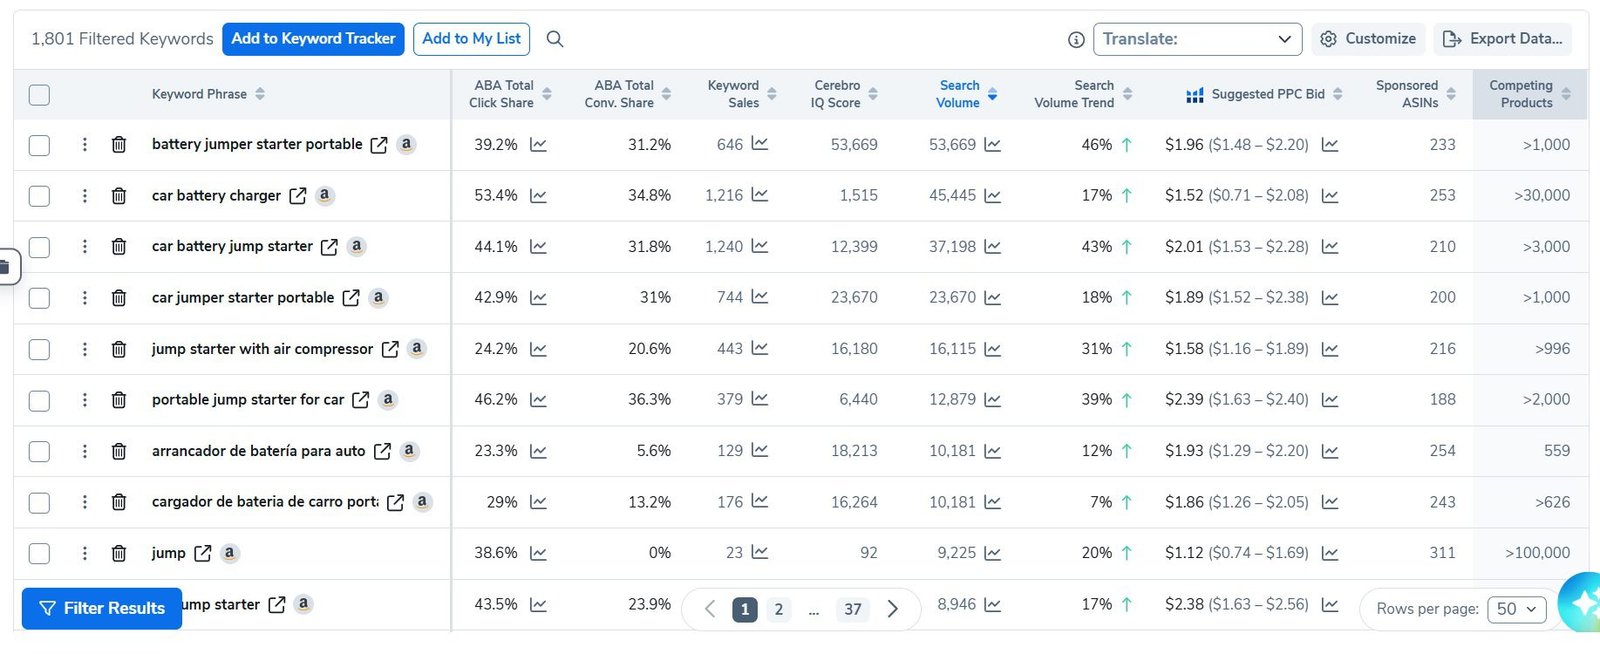
The keyword data produced by the reverse-ASIN search of 7 to 10 competitors. Each row shows search volume, Competitor Performance Score, Sponsored ASINs, Competing Products, CPR, and how many competitors rank on the term, which is everything needed to judge the competition keyword by keyword.
Finally, check your own position across the filtered list. Keywords where competitors rank in the top 10 while you sit past position 20, or nowhere at all, are your gap, and the gap splits into two buckets with different fixes. If you’re not indexed at all, fix placement first: title, bullets, and backend search terms. If you’re indexed but stuck between organic positions 15 and 40, the keyword needs sales velocity, which is what Step 10 and the CPR number are for.
This exact gap analysis is how we turned around a Home and Kitchen account we took over in June 2022. Cerebro surfaced competitor keywords the account had never targeted in either the listing or the campaigns, and rebuilding the keyword architecture around that list with a Broad, Phrase, Exact PPC campaigns took the account from $50K to $170K per month in seven months while TACoS held at 21%.
Cerebro organic ranks come from periodic crawls, and for low-volume keywords the data can be 2 to 3 weeks stale. Before rewriting a listing around a gap keyword, search it in an incognito window and confirm who actually ranks today. We’ve caught tool data showing a competitor at position 6 on a term where their ASIN had been out of stock for a month.
Step 6: Analyze Their Listings the Way a Shopper Sees Them
Open each tracking-list competitor’s listing on your phone, not your desktop. Most Amazon traffic is mobile, and an image that looks great on a big screen often fails as a small thumbnail.
Walk through the listing in the same order a shopper does, and ask one plain question at each stop:
- Main image. At thumbnail size, what do you understand in one second? Pack count, size, main feature? If their image answers a question yours doesn’t, they win the click.
- Title. Read only the first 80 characters, because that’s roughly where mobile cuts it off. What did they choose to say first?
- Price and coupon. What does the shopper actually see? $19.99 with a 15% coupon feels like a deal. A flat $21.99 sitting next to it doesn’t.
- Reviews. Check both the rating and the count. Below 4.2 stars, a listing leaks sales. And between two products at 4.6 stars, the one with 3,000 reviews beats the one with 180 unless something else breaks the tie.
- A+ content. Scroll down. Are they answering real doubts like sizing, compatibility, and durability, or just repeating the bullets with pictures?
Score your own listing against each competitor on these five points: win, lose, or tie on each one. Your losses, ranked by how easy they are to fix, become your work list. It really is that simple.
This exercise is what turned around the account of our partner brand. The product was losing the click at the main image and losing the sale at A+ content. The rebuild that followed doubled CTR from 0.4% to 0.8%, lifted conversion from 14% to 23%, and added $91K in organic revenue without a dollar of extra ad spend.
Step 7: Check Their Fulfillment, Buy Box, and Brand Strength
A listing is only one part of a competitor’s business. How they deliver, who controls their Buy Box, and how large their brand is behind the listing all change how you should compete against them. Check three things for each tracking-list competitor.
Fulfillment method and delivery speed
Check whether each competitor runs FBA or FBM and whether their listing carries the Prime badge. Amazon shows this on the listing under the price and delivery estimate. Delivery speed influences the purchase decision as much as price in many categories, and a competitor offering next-day Prime delivery will outsell a faster-looking listing that ships in a week.
If a strong competitor sells through FBM without Prime, that is an opening: matching their listing quality while offering Prime delivery through FBA or Seller Fulfilled Prime gives you an advantage their listing cannot answer. If every competitor already has Prime, delivery is the entry requirement, and the competition moves to price, reviews, and content.
Buy Box ownership and seller count
Open each competitor’s listing and check how many sellers are on it. Amazon shows this under “Other Sellers on Amazon” or in the “New (x) from” line. A listing with one seller, usually the brand owner, sets its price deliberately. A listing with 5 or more resellers competes for the Buy Box internally, and its price drops come from resellers undercutting each other rather than from strategy.
This distinction matters when you read their price history in the next step. Price cuts on a single-seller listing are planned moves worth studying. Price cuts on a reseller-heavy listing are noise, and that listing is also more vulnerable: reseller-heavy products usually have weaker brand control, inconsistent stock, and no coordinated advertising behind them.
Storefront and brand range
Click the competitor’s brand name on the listing to open their storefront and review their full product range. A seller with one product defends that product with everything they have. A brand with 40 products spreads its attention, and its advertising budget, across the catalog.
The review count across their range also indicates how established the brand is. A brand with deep review counts on every product has been building for years and will respond to your moves slowly but with resources. A newer brand with one strong product and several weak ones is testing, and the weak products show you which offers the market has already rejected.
Step 8: Pull Their Price History From Keepa
Today’s price tells you almost nothing. A competitor showing $24.99 right now might spend most of the year at $17.99, and Keepa is how you find out.
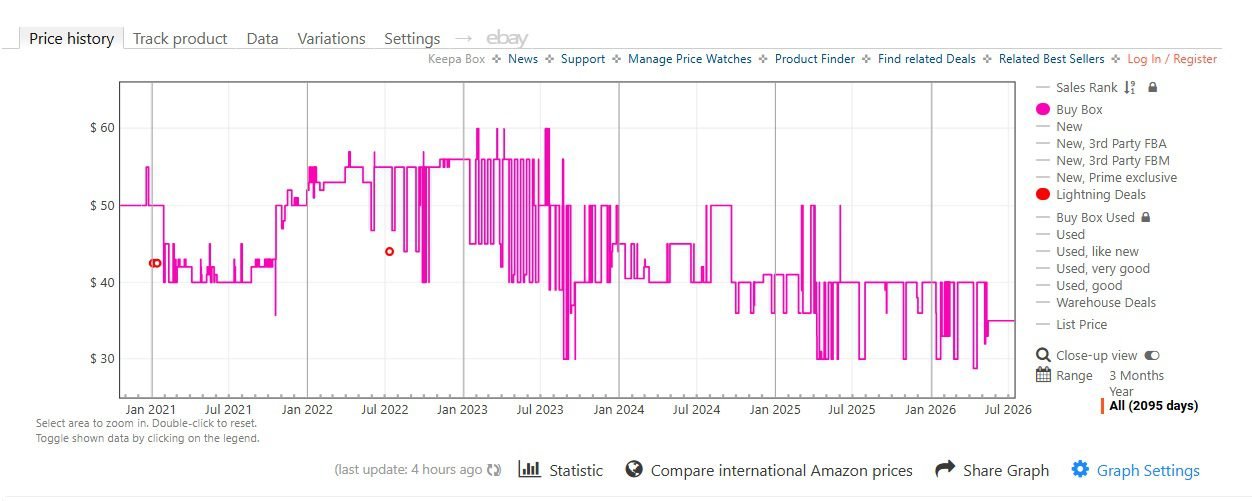
A Keepa chart showing a competitor product’s price history over time. The short sharp drops are deals and coupons, the flat empty stretches are out-of-stock windows, and the sales rank overlay shows how the market responds to each price move.
Four things to look for on the chart:
- Their real price. Find the price they sell at most of the time. If they ran $17.99 deals in 9 of the last 12 months, plan your margin against $18, not $25.
- Their deal rhythm. Short, sharp price drops are Lightning Deals and coupons. A competitor dropping price every 3 to 4 weeks is buying rank on a schedule, and your organic rank will dip on their deal days.
- Whether price even matters here. Watch what sales rank does when they cut price. If a $3 drop barely moves their BSR, shoppers in this niche don’t chase price, so don’t lead with it either. If BSR jumps on every drop, price is the lever.
- Stock gaps. Flat, empty stretches in the offer history are out-of-stock windows, and they explain rank moves that otherwise look random. They’re also your opportunity: when a tracking-list competitor goes out of stock, raise your bids 20 to 30% on your shared keywords, hold your price steady, and check your own stock can absorb the extra sales first.
While you’re here, compare per-unit prices across pack sizes the same way you did in Step 4. A 3-pack at $29.99 is $10 a unit. Your single at $12.99 is 30% more expensive per unit, even though your listing price looks lower on the page.
Step 9: Mine Competitor Reviews
Competitor reviews are free research twice over: they tell you what to fix in your product and what to say in your listing. Here’s the process:
- Open each tracking-list competitor’s reviews and filter to 1, 2, and 3 stars.
- Copy the most recent 100 critical reviews into a spreadsheet.
- Tag each one by complaint type: sizing, durability, packaging, instructions, missing feature, shipping damage.
- Count the tags. Any complaint showing up in more than 10 out of 100 reviews is a pattern, not bad luck.
Then read their 5-star reviews too, because those tell you which promise the product actually keeps. The exact words happy customers use belong in your bullets. Customers write better copy than agencies do.
Everything you find feeds three places:
- Your product: fix the pattern complaint in your next production run.
- Your listing: answer the competitor’s known weakness directly in bullet 2 or 3.
- Your A+ content: if 14% of their critical reviews mention the handle snapping, your section on reinforced construction is the reason a comparison shopper picks you.
Review mining works best when a competitor has at least 200 reviews. Below that, you may only find 20 or 30 critical reviews, and 3 complaints about packaging out of 30 reviews is not enough data to act on.
Also check whether a complaint is specific to one competitor or common across the entire category. If only one competitor gets complaints about weak packaging, that is a weakness you can target in your listing. But if every product in the category gets the same complaint, the problem usually comes from the product itself, and fixing it in your version will raise your manufacturing cost. Confirm with your supplier what the fix costs before you advertise it as a feature.
Step 10: Read Their PPC Footprint and Cost Out the Fight
The Amazon search results page is mostly an auction now. On a typical top search keyword, a shopper sees Sponsored Brands, 2 to 4 Sponsored Products slots, and often a Sponsored Brands Video before the fourth organic result. So before you spend, map who you’re bidding against and work out what the fight will cost.
Map their placements. Search your top 10 keywords in an incognito window at three different times of day, and log who holds top-of-search, who runs video ads, and who advertises on your own listing.
Check real bids with a dummy campaign. Amazon itself will give you live auction data for free. Go to Campaign Manager, create a new Sponsored Products campaign with manual targeting, and add your top keywords as exact match. Amazon shows you the suggested bid and bid range for each keyword based on the live auction. Note the numbers down, then archive the campaign without launching it. You’ve just pulled real market bids without spending a dollar.
Say your product sells at $25 and your margin before ad spend is 35%. That margin is your break-even ACoS: you can spend $8.75 on ads per sale before you lose money. At a typical 10% conversion rate, you need about 10 clicks to get one sale, which keeps the maths simple: your cost per sale is roughly the bid times 10.
Here’s how that plays out across five keywords:
| Keyword | Amazon suggested bid | Est. cost per sale (10 clicks) | ACoS at $25 price | vs 35% break-even |
|---|---|---|---|---|
| Keyword A (head term) | $2.00 | $20.00 | 80% | Losing $11.25 per sale |
| Keyword B | $1.40 | $14.00 | 56% | Losing $5.25 per sale |
| Keyword C | $1.10 | $11.00 | 44% | Losing $2.25 per sale |
| Keyword D | $0.85 | $8.50 | 34% | Break-even, roughly |
| Keyword E (long tail) | $0.60 | $6.00 | 24% | Earning $2.75 per sale |
Sample figures for illustration. Pull real bids from your own dummy campaign and use your own margin.
Keywords D and E pay for themselves from day one, so they get budget first. Keywords A through C aren’t automatically off-limits, but they’re rank investments: you’re paying above margin now to earn organic rank that pays you back later, and the CPR number from Step 5 tells you how many of those orders you need to get to push organic rank.
Target your tracking-list competitors’ ASINs with Product Targeting campaigns, but only where your listing wins the Step 6 scorecard against them: better rating, better per-unit price, or a solved complaint from their reviews.
On defence, run Product Targeting on your own listings so the ad slots under your bullets show your variations instead of a competitor’s offer. On the $6.5M Tools and Home Improvement account we manage, defensive PPC ran across the full engagement while the account held 15.4% net profit and grew 24% year on year. Competitors paying to sit on your listing are taking sales you already earned the traffic for.
Run This Analysis With the Free Ecom Brainly Competitor Analysis Tool
Steps 3 to 5 of this guide require exporting data from Helium 10 X-Ray and Cerebro, then combining both exports in a spreadsheet to compare competitors and find keyword gaps. This work takes several hours for each analysis, and it has to be repeated every quarter.
We built the Amazon Competitor Analysis Tool to remove that manual work. Upload your Cerebro and X-Ray exports, and the tool builds the complete analysis automatically. It is free to use, and it runs on the same process described in this article.
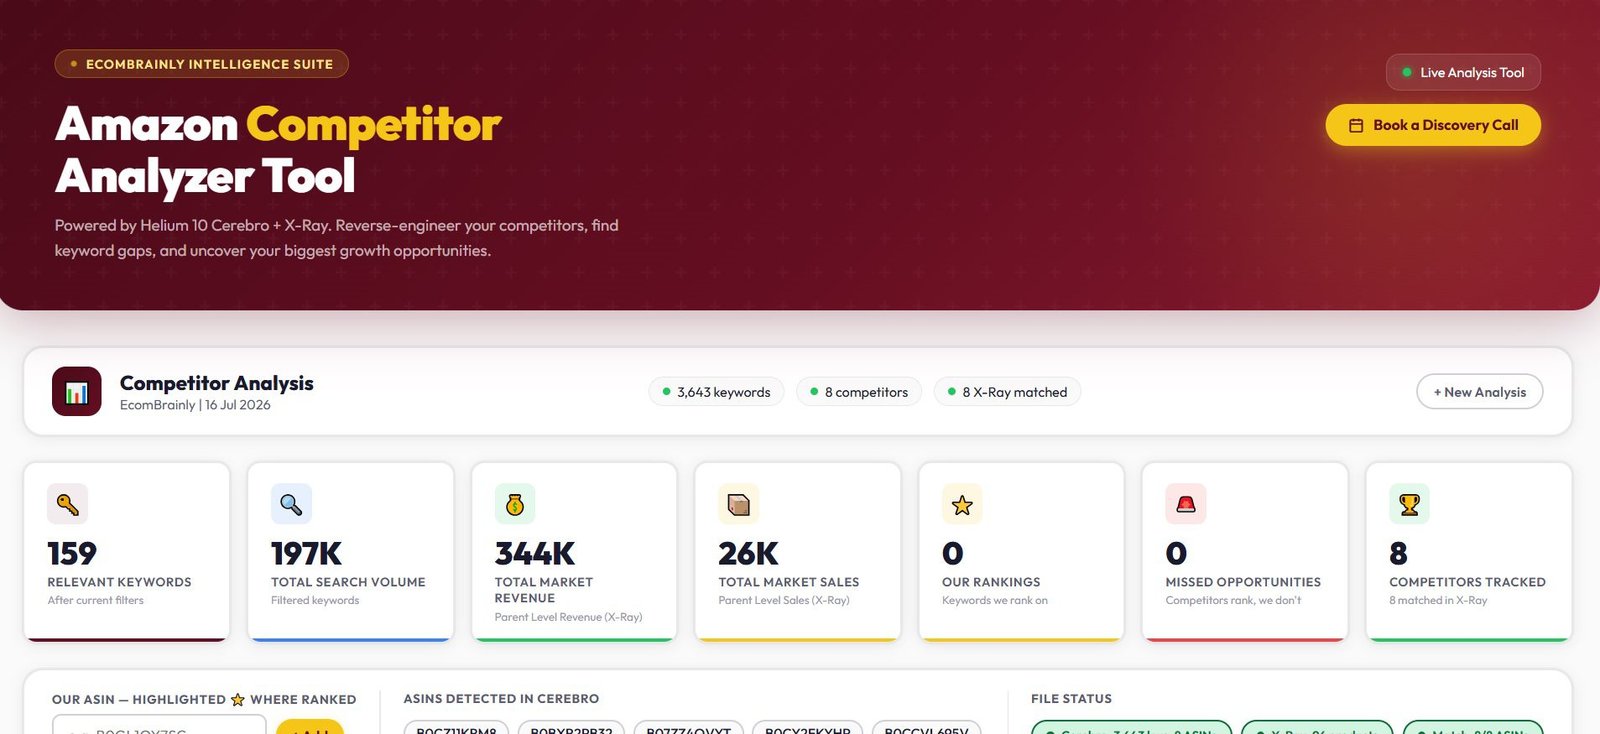
The main dashboard of the Amazon Competitor Analysis Tool. It presents the niche in a single view, including total keywords found, market search volume, market revenue and sales, your current rankings, missed keyword opportunities, and the number of competitors tracked.
The tool reads every competitor ASIN from the Cerebro export and matches it against the X-Ray data. This produces the market size and sales estimates from Step 3 and the competitor comparison from Step 4 without any manual data entry.
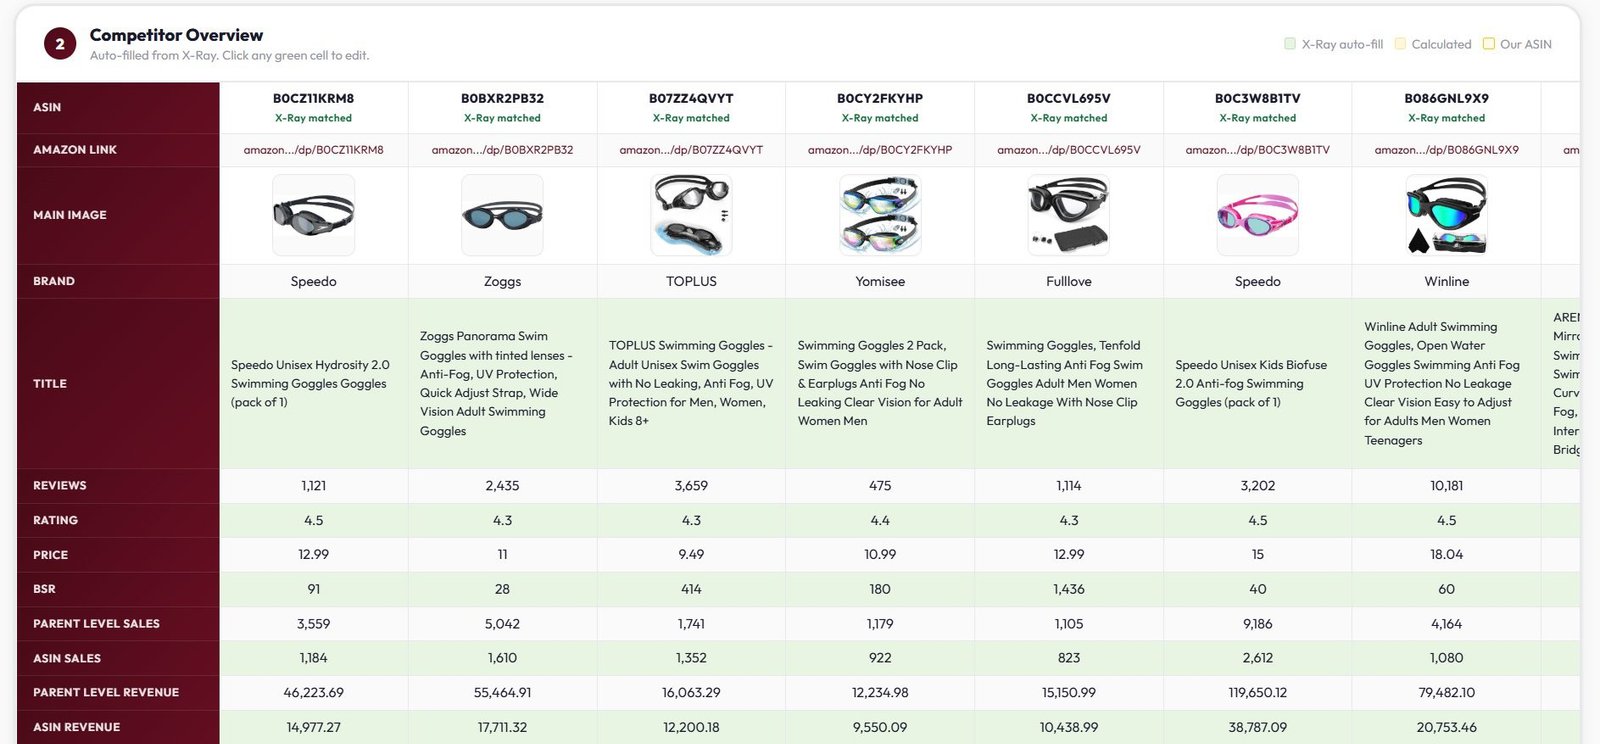
The competitor overview, filled automatically from the X-Ray export. Each competitor appears in its own column with title, reviews, rating, price, BSR, sales, and revenue, so the side-by-side comparison from Steps 3 and 4 is ready on one screen.
For the keyword research in Step 5, the tool applies the Competitor Performance Score filter and marks every ranking position with a colour code. Keywords where competitors rank and you do not are visible immediately, without sorting the export by hand.
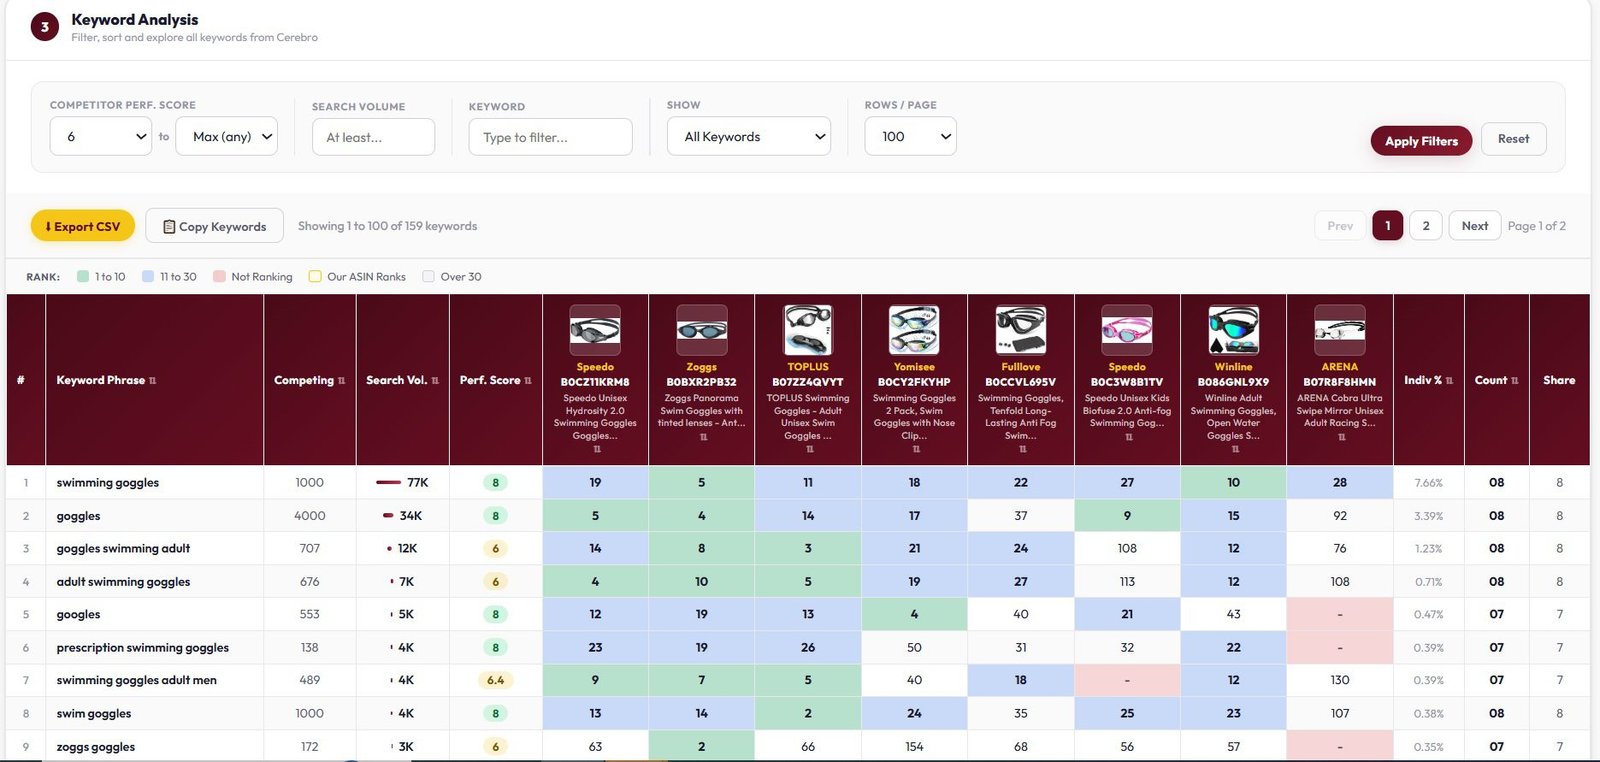
The keyword analysis view built from the Cerebro export. Each keyword shows its search volume, competing products, and Performance Score, and every competitor’s organic rank is colour-coded by position so keyword gaps are easy to identify.
Try the Free Competitor Analysis Tool
Upload your Cerebro and X-Ray exports and get the full competitor analysis in minutes. No signup required.
Which Tools You Actually Need
| Tool | What it gives you | Cost | Needs Brand Registry? |
|---|---|---|---|
| Brand Analytics (Top Search Terms) | Click share and conversion share of top 3 ASINs per search term | Free with registry | Yes |
| Search Query Performance | Your impression, click, and purchase share per query | Free with registry | Yes |
| Helium 10 (Cerebro/X-Ray) | Reverse-ASIN keywords, CPR, sales estimates, market data | From ~$79/month | No |
| Keepa | Price history, BSR history, stock tracking, out-of-stock alerts | ~€19/month | No |
| Campaign Manager (dummy campaign) | Real suggested bids and bid ranges per keyword | Free | No |
| Manage Your Experiments | A/B testing of images, titles, A+ against your scorecard findings | Free with registry | Yes |
Costs are approximate entry points and change often. “Free with registry” tools require enrolment in Amazon Brand Registry. If you can only afford one paid tool while unregistered, take Helium 10 for the Cerebro and X-Ray work, with Keepa as your second addition for price and stock history.
Put It on a Calendar or It Will Not Happen
Competitor analysis is not a one-time task. Prices, rankings, and ad placements change every week, so the analysis needs to run on a fixed schedule:
- Weekly (15 minutes): Keepa alerts for tracking-list price moves and stockouts, plus an SQP check on your top 5 queries if you’re registered.
- Monthly (2 hours): Top Search Terms click-share check on your money keywords, an incognito placement check, and an update to the Step 6 scorecard.
- Quarterly (half a day): A fresh Cerebro pull on List 1, a review mining update, and an honest look at whether both lists still hold the right ASINs. Lists go stale. A new launch with 400 reviews in 90 days belongs on your tracking list, while the fading incumbent you’ve watched since 2023 might not.
One final point on how this process fails: it fails when it produces reports instead of decisions. Every monthly review should end with at least one specific change to your account, such as a bid adjustment, a price change, a new image test, or a revised reorder quantity. If a review ends with no changes, the analysis is not adding value.
Keep the workload within the time limits above. A tracking system that requires more time than one person can give it will be abandoned within a few months, and an abandoned system is worth less than a simple one that runs every week.
Frequently Asked Questions
How do I find my competitors on Amazon?
Search your main keyword on Amazon and study the top-ranking products on page one, then repeat for your 3 to 5 most important keywords. Keep the products that match yours in design, pack size, flavour, and price band, then build two lists: 7 to 10 related competitors for keyword research, and 3 to 5 nearly identical ones for close tracking.
Can you see competitors’ sales on Amazon?
Not directly, but you can estimate them. Helium 10 X-Ray and Jungle Scout give monthly unit and revenue estimates per ASIN straight from the search results page. Use the estimates to compare competitors against each other and to work out your rough market share, not for absolute financial planning, because BSR-based estimates swing after deals and stockouts.
How often should I run Amazon competitor analysis?
Split it by depth: automated price and stock alerts run continuously, a 15-minute check happens weekly, a 2-hour click-share and placement review happens monthly, and a full refresh of keywords, reviews, and both competitor lists happens quarterly. A one-time analysis goes stale within weeks, because prices, deals, and rankings move constantly.
Is Amazon competitor analysis free?
Partly. Brand Analytics, Search Query Performance, the dummy campaign bid check, and Manage Your Experiments are free, though most need Brand Registry or an ad account. The manual work, listing scorecards, review mining, and incognito placement checks, costs nothing. The paid layer worth having is Helium 10 for Cerebro and X-Ray, with Keepa second for price history.
What should I do first if I’ve never done this?
Search your main keyword, pick the top 3 products that match yours, and score your listing against theirs on main image, title, price, and reviews. That 30-minute exercise usually explains more about your sales than a month of campaign reports, and it tells you which of the ten steps to run in full first.
Want Us to Run This Analysis on Your Account?
We review your niche, your competitors, and your PPC data for free. No commitment.